D1.04: Examples 10–11
Example 10
A certain river in Georgia is polluted with coliform bacteria. This has been blamed primarily on the dairy farmers whose farms are in the watershed of the river. This formula is used to model the cost in dollars, y, to remove p% of the bacterial pollution from the river. How much of the pollution can be removed if $1.0 million is available to spend on this? [latex]y=\frac{380,000p}{100-p}[/latex]Answer: We must graph this formula over the range of values [latex]0\le{p}<100[/latex] and then see for what values of p the y value is less than or equal to $1.0 million. Use parentheses when putting this formula into your calculator. When we write this by hand it is obvious that the entire numerator and entire denominator should be evaluated separately before dividing. But when we enter it into a calculator, we have to use parentheses to indicate that. For p = 20, use (380000*20)/(100 – 20) =
| p | y |
| 0 | 0 |
| 10 | 42222.22 |
| 20 | 95000.00 |
| 30 | 162857.1 |
| 40 | 253333.3 |
| 50 | 380000.0 |
| 60 | 570000.0 |
| 70 | 886666.7 |
| 80 | 1520000.0 |
| 90 | 3420000.0 |
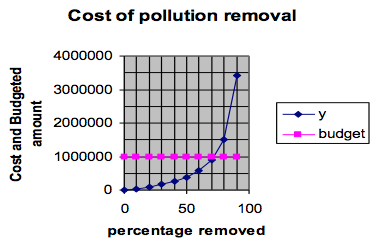
 We graphed the formula and then put a line across at $1 million. This crosses the cost graph at a bit more than. So we estimate that about 72% of the pollution can be removed for $1.0 million.
We could expand the scale or do more numerical computation to estimate this more precisely. That would be tedious to do by hand, but would be easy to do with a spreadsheet.
Example 11
A certain kind of appliance is sold for $10 each and the manufacturer can sell all she produces at that price. To produce these appliances requires a fixed cost of $14,220 per month (equipment depreciation, salaries, utilities, etc.) and the variable cost per appliance is $2.10.- Write a formula for the cost of producing x appliances.
- Write another formula for the revenue produced by selling x appliances.
- Graph both formulas for [latex]0\le{x}\le2500[/latex].
- For what value of x is the cost equal to the revenue? (That point on the graph is called the “break-even” point.)
Answer: Let C = total cost of x appliances. C = fixed cost + variable cost times number of appliances. Thus [latex]C=14220+2.10\cdot{x}[/latex] Let R = total revenue from x appliances. R = price per appliance times number of appliances Thus [latex]R=10.00\cdot{x}[/latex]
| x | C | R |
| 0 | 14220 | 0 |
| 500 | 15270 | 5000 |
| 1000 | 16320 | 10000 |
| 1500 | 17370 | 15000 |
| 2000 | 18420 | 20000 |
| 2500 | 19470 | 25000 |
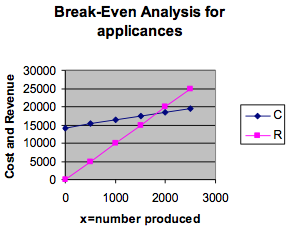
 Notice that these are equal for some x-value about halfway between 1500 and 2000. So we plot more values in this range and find that they are equal at [latex]x=1800[/latex].
We plot more values in this range and find that the cost and the revenue are equal at [latex]x=1800[/latex].
So, for 1800 appliances, both the cost and the revenue are $18,000. That means that, if we make 1800 appliances, we will “break even.”
Licenses & Attributions
CC licensed content, Shared previously
- Mathematics for Measuring. Authored by: Mary Parker and Hunter Ellinger. License: CC BY: Attribution.

