
M1.08: Exercises
Part I
Repeat the Examples 1-8Part II
- State the logarithms of these numbers, to three decimal places:
- 452.6
- 0.2
- 1,000
- 4.5×10¹⁵
- 0.00724
- 6.4×10⁻⁸
- 7.66
- State the logarithms of these numbers, to three decimal places:
- 15,250
- 0.0001
- 1.4×10⁻⁵
- 1.11
- 200
- 7.5×10¹²
- 0.000215
- What values have the following logarithms (round answers to three significant digits):
- 3.526
- 0.01
- -2.769
- 10
- -0.168
- 5.728
- 0
- What values have the following logarithms (round answers to three significant digits):
- -2
- 1.592
- 5.923
- -4.511
- -1.735
- 0.301
- 23.301
- Which of these values has a logarithm greater than 1?
- 45.8
- 8.3
- 195,680
- -15.2
- 0.783
- 5.4×10¹²
- 10
- Which of these values has a logarithm less than 1?
- 6.8
- 55.5
- 4.2×10⁹
- 0.00002
- 75
- 9.27×10⁻³
- 10
- Which of the graphs below indicate that the corresponding dataset follows an exponential pattern?
Graph A 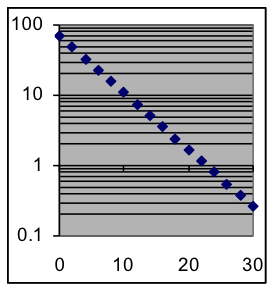
Graph B 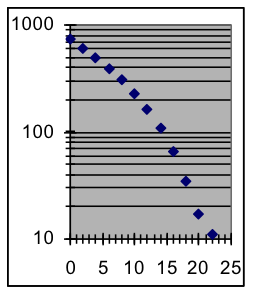
Graph C 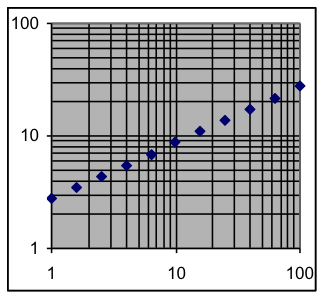
- Which of the graphs above indicate that the corresponding dataset follows a power-function pattern?
- Use a semi-log graph to show whether dataset A is exponential.The point halfway between the x=1 and x=2 data points has a y value that is about halfway between y=100 and y=200.
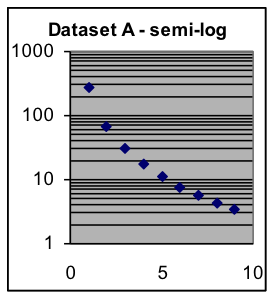
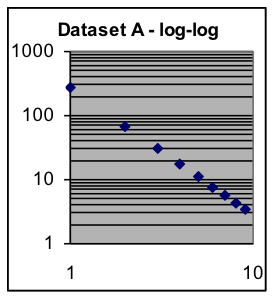
Dataset A x Y 1 275.3 2 68.8 3 30.6 4 17.2 5 11.0 6 7.6 7 5.6 8 4.3 9 3.4 Dataset B x y 20 4 40 16 60 36 80 64 100 100 120 144 140 196 160 256 180 324 - Use a semi-log graph to show whether dataset B is exponential.
- Use the Exercise 17 graph to interpolate an estimated value for x = 1.5.
- Use the Exercise 18 graph to interpolate an estimated value for x = 170.
- Use a log-log graph to tell if dataset A approximates a power function.
- Use a log-log graph to tell if dataset B approximates a power function.
- Scientists have found that the total energy requirements of animals increase somewhat more slowly than body size. For example, a 1.2-pound mongoose requires 47 kilocalories per day, a 10-pound fox requires 240, a 22-pound bobcat requires 440, a 100-pound wolf requires 1350, a 300-pound lion requires 3100, a 400-pound tiger requires 3800, and a 700-pound polar bear requires 5900.
- What model is appropriate for predicting energy requirement from weight? (You will need to decide on the type of model, then find the best-fit parameters to this data for that type.)
- What daily energy requirement can be expected for a 45-pound lynx?
| Infant data averages for Exercises 24–28 | ||
|---|---|---|
| Age (months) | Weight (pounds) | Length (inches) |
| 3 | 13.0 | 24.0 |
| 6 | 17.2 | 26.7 |
| 9 | 20.3 | 28.6 |
| 12 | 22.2 | 30.0 |
| 15 | 24.0 | 31.4 |
| 18 | 25.3 | 32.5 |
| 21 | 26.6 | 33.6 |
| 24 | 27.8 | 34.5 |
| (US Natl Cen Health Stat) | ||
- Fit a power-function model to the infant data shown above, using age as the input variable and average weight as the output variable.
- State the best-fit scale and power parameters in an appropriate model formula.
- Is this model a good fit to the data?
- Compute the predicted average infant weight for an age of 20 months.
- Fit a power-function model to the infant data shown above, using average weight as the input variable and age as the output variable.
- State the best-fit scale and power parameters in an appropriate model formula.
- What is the relationship of the power parameter in this model with the power parameter of the model found in the previous problem? Why?
- Fit a power-function model to the infant data shown above, using age as the input variable and average length as the output variable.
- State the best-fit scale and power parameters in an appropriate model formula.
- Is this model a good fit to the data?
- Compute the predicted average infant length for an age of 20 months.
- Fit a power-function model to the infant data shown above, using average length as the input variable and average weight as the output variable.
- State the best-fit scale and power parameters in an appropriate model formula.
- Use the predicted average infant length for an age of 20 months (computed in section c of the previous exercise) as input to the model found in this exercise, producing as output a predicted infant weight for an age of 20 months. What earlier exercise also predicted this quantity? How well do the predictions match?
- Using the results of the previous exercise (without doing any more fitting), use a single computation to estimate what the best-fit power parameter would be for a model based on this data that predicts average length from average weight.
Licenses & Attributions
CC licensed content, Shared previously
- Mathematics for Modeling. Authored by: Mary Parker and Hunter Ellinger. License: CC BY: Attribution.
