Reading: Instantaneous Rate of Change and Tangent Lines
Instantaneous Velocity
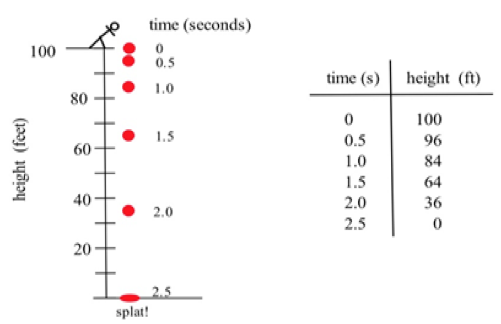
Figure 1
- How long did it take for the tomato n to drop 100 feet? 2.5 seconds
- How far did the tomato fall during the first second? 100 – 84 = 16 feet
- How far did the tomato fall during the last second? 64 – 0 = 64 feet
- How far did the tomato fall between t =.5 and t = 1? 96 – 84 = 12 feet
Some other questions require a little calculation:
- What was the average velocity of the tomato during its fall?
Average velocity = [latex] \frac{\text{distance fallen}}{\text{total time}} = \frac{\Delta \text{position}}{\Delta \text{time}} = \frac{-100ft}{2.5s} = -40 ft/s [/latex]
- What was the average velocity between t = 1 and t = 2 seconds?
Average velocity = [latex] \frac{\Delta \text{position}}{\Delta \text{time}}[/latex] = [latex] \frac{36ft - 84ft}{2s - 1s} [/latex] = [latex] \frac{-48ft}{1s}[/latex] = [latex] -48ft/s [/latex]
Some questions are more difficult.
- How fast was the tomato falling 1 second after it was dropped?
This question is significantly different from the previous two questions about average velocity. Here we want the instantaneous velocity, the velocity at an instant in time. Unfortunately the tomato is not equipped with a speedometer so we will have to give an approximate answer.
One crude approximation of the instantaneous velocity after 1 second is simply the average velocity during the entire fall, –40 ft/s . But the tomato fell slowly at the beginning and rapidly near the end so the "–40 ft/s" estimate may or may not be a good answer.
We can get a better approximation of the instantaneous velocity at t=1 by calculating the average velocities over a short time interval near t = 1 . The average velocity between t = 0.5 and t = 1 is [latex] \frac{-12 \text{feet}}{0.5s} [/latex] = –24 ft/s, and the average velocity between t = 1 and t = 1.5 is [latex] \frac{-20 \text{feet}}{0.5s} [/latex] = –40 ft/s so we can be reasonably sure that the instantaneous velocity is between –24 ft/s and –40 ft/s.
In general, the shorter the time interval over which we calculate the average velocity, the better the average velocity will approximate the instantaneous velocity. The average velocity over a time interval is [latex] \frac{\Delta \text{position}}{\Delta \text{time}}[/latex], which is the slope of the secant line through two points on the graph of height versus time (see figure 2). The instantaneous velocity at a particular time and height is the slope of the tangent line to the graph at the point given by that time and height.
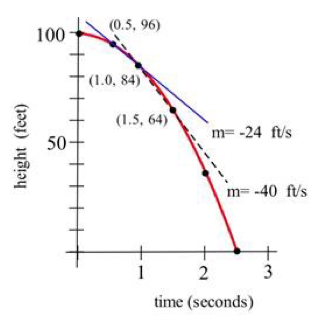
Figure 2
Average velocity = [latex] \frac{\Delta \text{position}}{\Delta \text{time}}[/latex] = slope of the secant line through 2 points.
Instantaneous velocity = slope of the line tangent to the graph.
Licenses & Attributions
CC licensed content, Shared previously
- Business Calculus. Provided by: Washington State Colleges Authored by: Dale Hoffman and Shana Calaway. Located at: https://docs.google.com/file/d/0B1lkHWwO61QEM0gwOFhES2N5Tlk/edit. License: CC BY: Attribution.

