
3B.2 Graph Linear Inequalities
3b.2 Learning Objectives
- Identify and follow steps for graphing a linear inequality in two variables
- Identify whether an ordered pair is in the solution set of a linear inequality
Graphing Inequalities
To graph an inequality:- Graph the related boundary line. Replace the <, >, ≤ or ≥ sign in the inequality with = to find the equation of the boundary line.
- Identify at least one ordered pair on either side of the boundary line and substitute those [latex](x,y)[/latex] values into the inequality. Shade the region that contains the ordered pairs that make the inequality a true statement.
- If points on the boundary line are solutions, then use a solid line for drawing the boundary line. This will happen for ≤ or ≥ inequalities.
- If points on the boundary line aren’t solutions, then use a dotted line for the boundary line. This will happen for < or > inequalities.
| x | y |
| 0 | 1 |
| 4 | 0 |
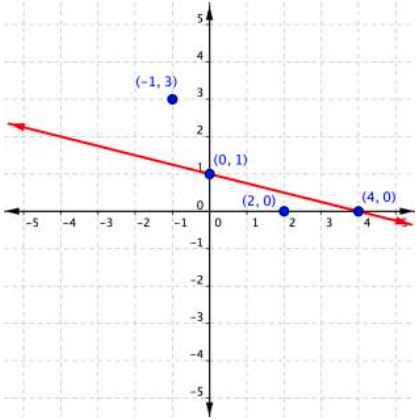 The next step is to find the region that contains the solutions. Is it above or below the boundary line? To identify the region where the inequality holds true, you can test a couple of ordered pairs, one on each side of the boundary line.
If you substitute [latex](−1,3)[/latex] into [latex]x+4y\leq4[/latex]:
The next step is to find the region that contains the solutions. Is it above or below the boundary line? To identify the region where the inequality holds true, you can test a couple of ordered pairs, one on each side of the boundary line.
If you substitute [latex](−1,3)[/latex] into [latex]x+4y\leq4[/latex]:
[latex]\begin{array}{r}−1+4\left(3\right)\leq4\\−1+12\leq4\\11\leq4\end{array}[/latex]
This is a false statement, since 11 is not less than or equal to 4. On the other hand, if you substitute [latex](2,0)[/latex] into [latex]x+4y\leq4[/latex]:[latex]\begin{array}{r}2+4\left(0\right)\leq4\\2+0\leq4\\2\leq4\end{array}[/latex]
This is true! The region that includes [latex](2,0)[/latex] should be shaded, as this is the region of solutions.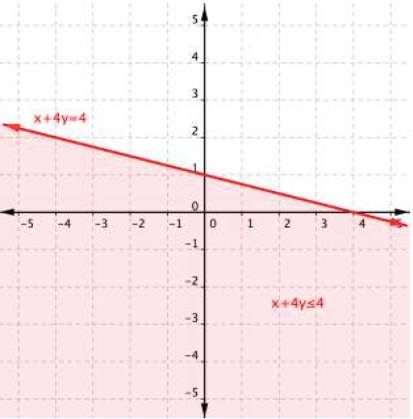 And there you have it—the graph of the set of solutions for [latex]x+4y\leq4[/latex].
3B.2.1 Graphing Linear Inequalities in Two Variables
https://youtu.be/2VgFg2ztspIExample 3B.2.A
Graph the inequality [latex]2y>4x–6[/latex].Answer: Solve for y.
[latex] \displaystyle \begin{array}{r}2y>4x-6\\\\\frac{2y}{2}>\frac{4x}{2}-\frac{6}{2}\\\\y>2x-3\\\end{array}[/latex]
Create a table of values to find two points on the line [latex] \displaystyle y=2x-3[/latex], or graph it based on the slope-intercept method, the b value of the y-intercept is [latex]-3[/latex] and the slope is 2. Plot the points, and graph the line. The line is dotted because the sign in the inequality is >, not ≥ and therefore points on the line are not solutions to the inequality.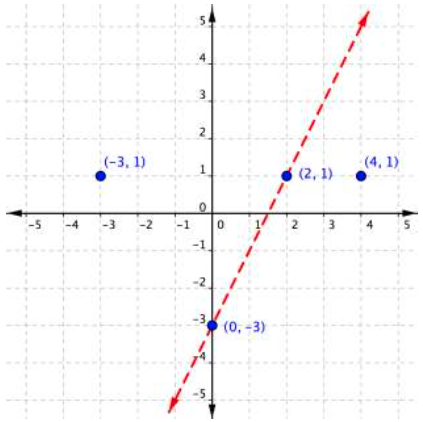
[latex] \displaystyle y=2x-3[/latex]
| x | y |
|---|---|
| 0 | [latex]−3[/latex] |
| 2 | 1 |
[latex]\begin{array}{l}2y>4x–6\\\\\text{Test }1:\left(−3,1\right)\\2\left(1\right)>4\left(−3\right)–6\\\,\,\,\,\,\,\,2>–12–6\\\,\,\,\,\,\,\,2>−18\\\text{TRUE}\\\\\text{Test }2:\left(4,1\right)\\2(1)>4\left(4\right)– 6\\\,\,\,\,\,\,2>16–6\\\,\,\,\,\,\,2>10\\\text{FALSE}\end{array}[/latex]
Answer
The graph of the inequality [latex]2y>4x–6[/latex] is: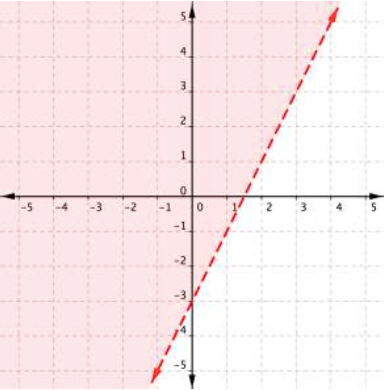
3B.2.2 Solution Sets of Inequalities
The graph below shows the region of values that makes the inequality [latex]3x+2y\leq6[/latex] true (shaded red), the boundary line [latex]3x+2y=6[/latex], as well as a handful of ordered pairs. The boundary line is solid because points on the boundary line [latex]3x+2y=6[/latex] will make the inequality [latex]3x+2y\leq6[/latex] true.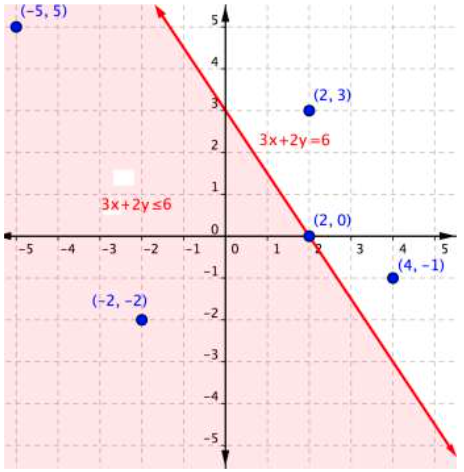 You can substitute the x- and y-values in each of the [latex](x,y)[/latex] ordered pairs into the inequality to find solutions. Sometimes making a table of values makes sense for more complicated inequalities.
| Ordered Pair | Makes the inequality [latex-display]3x+2y\leq6[/latex-display] a true statement | Makes the inequality [latex-display]3x+2y\leq6[/latex-display] a false statement |
|---|---|---|
| [latex](−5, 5)[/latex] | [latex]\begin{array}{r}3\left(−5\right)+2\left(5\right)\leq6\\−15+10\leq6\\−5\leq6\end{array}[/latex] | |
| [latex](−2,−2)[/latex] | [latex]\begin{array}{r}3\left(−2\right)+2\left(–2\right)\leq6\\−6+\left(−4\right)\leq6\\–10\leq6\end{array}[/latex] | |
| [latex](2,3)[/latex] | [latex]\begin{array}{r}3\left(2\right)+2\left(3\right)\leq6\\6+6\leq6\\12\leq6\end{array}[/latex] | |
| [latex](2,0)[/latex] | [latex]\begin{array}{r}3\left(2\right)+2\left(0\right)\leq6\\6+0\leq6\\6\leq6\end{array}[/latex] | |
| [latex](4,−1)[/latex] | [latex]\begin{array}{r}3\left(4\right)+2\left(−1\right)\leq6\\12+\left(−2\right)\leq6\\10\leq6\end{array}[/latex] |
Example 3B.2.B
Use the graph to determine which ordered pairs plotted below are solutions of the inequality [latex]x–y<3[/latex].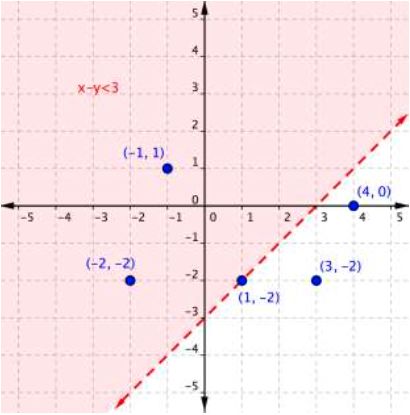
Answer: Solutions will be located in the shaded region. Since this is a “less than” problem, ordered pairs on the boundary line are not included in the solution set. These values are located in the shaded region, so are solutions. (When substituted into the inequality [latex]x–y<3[/latex], they produce true statements.)
[latex](−1,1)[/latex]
[latex](−2,−2)[/latex]
These values are not located in the shaded region, so are not solutions. (When substituted into the inequality [latex]x-y<3[/latex], they produce false statements.)[latex](1,−2)[/latex]
[latex](3,−2)[/latex]
[latex](4,0)[/latex]
Answer
[latex](−1,1)\,\,\,(−2,−2)[/latex]Example 3B.2.C
Is [latex](2,−3)[/latex] a solution of the inequality [latex]y<−3x+1[/latex]?Answer: If [latex](2,−3)[/latex] is a solution, then it will yield a true statement when substituted into the inequality [latex]y<−3x+1[/latex].
[latex]y<−3x+1[/latex]
Substitute [latex]x=2[/latex] and [latex]y=−3[/latex] into inequality.[latex]−3<−3\left(2\right)+1[/latex]
Evaluate.[latex]\begin{array}{l}−3<−6+1\\−3<−5\end{array}[/latex]
This statement is not true, so the ordered pair [latex](2,−3)[/latex] is not a solution.Answer
[latex](2,−3)[/latex] is not a solution.Summary
When inequalities are graphed on a coordinate plane, the solutions are located in a region of the coordinate plane, which is represented as a shaded area on the plane. The boundary line for the inequality is drawn as a solid line if the points on the line itself do satisfy the inequality, as in the cases of ≤ and ≥. It is drawn as a dashed line if the points on the line do not satisfy the inequality, as in the cases of < and >. You can tell which region to shade by testing some points in the inequality. Using a coordinate plane is especially helpful for visualizing the region of solutions for inequalities with two variables.Licenses & Attributions
CC licensed content, Original
- Ex 1: Graphing Linear Inequalities in Two Variables (Slope Intercept Form). Authored by: James Sousa (Mathispower4u.com) . License: CC BY: Attribution.
CC licensed content, Shared previously
- Ex 2: Graphing Linear Inequalities in Two Variables (Standard Form). Authored by: James Sousa (Mathispower4u.com) . License: CC BY: Attribution.
- Unit 13: Graphing, from Developmental Math: An Open Program. Provided by: Monterey Institute of Technology and Education Located at: https://www.nroc.org/. License: CC BY: Attribution.
- Use a Graph Determine Ordered Pair Solutions of a Linear Inequalty in Two Variable. Authored by: James Sousa (Mathispower4u.com) for Lumen Learning. License: CC BY: Attribution.
- Ex: Determine if Ordered Pairs Satisfy a Linear Inequality. Authored by: James Sousa (Mathispower4u.com) . License: CC BY: Attribution.
