We can plot a set of points to represent an equation. When such an equation contains both an
x variable and a
y variable, it is called an
equation in two variables. Its graph is called a
graph in two variables. Any graph on a two-dimensional plane is a graph in two variables.
Suppose we want to graph the equation [latex]y=2x - 1[/latex]. We can begin by substituting a value for
x into the equation and determining the resulting value of
y. Each pair of
x and
y-values is an ordered pair that can be plotted. The table below lists values of
x from –3 to 3 and the resulting values for
y.
| [latex]x[/latex] |
[latex]y=2x - 1[/latex] |
[latex]\left(x,y\right)[/latex] |
| [latex]-3[/latex] |
[latex]y=2\left(-3\right)-1=-7[/latex] |
[latex]\left(-3,-7\right)[/latex] |
| [latex]-2[/latex] |
[latex]y=2\left(-2\right)-1=-5[/latex] |
[latex]\left(-2,-5\right)[/latex] |
| [latex]-1[/latex] |
[latex]y=2\left(-1\right)-1=-3[/latex] |
[latex]\left(-1,-3\right)[/latex] |
| [latex]0[/latex] |
[latex]y=2\left(0\right)-1=-1[/latex] |
[latex]\left(0,-1\right)[/latex] |
| [latex]1[/latex] |
[latex]y=2\left(1\right)-1=1[/latex] |
[latex]\left(1,1\right)[/latex] |
| [latex]2[/latex] |
[latex]y=2\left(2\right)-1=3[/latex] |
[latex]\left(2,3\right)[/latex] |
| [latex]3[/latex] |
[latex]y=2\left(3\right)-1=5[/latex] |
[latex]\left(3,5\right)[/latex] |
We can plot these points from the table. The points for this particular equation form a line, so we can connect them.
This is not true for all equations.

Note that the
x-values chosen are arbitrary regardless of the type of equation we are graphing. Of course, some situations may require particular values of
x to be plotted in order to see a particular result. Otherwise, it is logical to choose values that can be calculated easily, and it is always a good idea to choose values that are both negative and positive. There is no rule dictating how many points to plot, although we need at least two to graph a line. Keep in mind, however, that the more points we plot, the more accurately we can sketch the graph.
How To: Given an equation, graph by plotting points
- Make a table with one column labeled x, a second column labeled with the equation, and a third column listing the resulting ordered pairs.
- Enter x-values down the first column using positive and negative values. Selecting the x-values in numerical order will make graphing easier.
- Select x-values that will yield y-values with little effort, preferably ones that can be calculated mentally.
- Plot the ordered pairs.
- Connect the points if they form a line.
Example: Graphing an Equation in Two Variables by Plotting Points
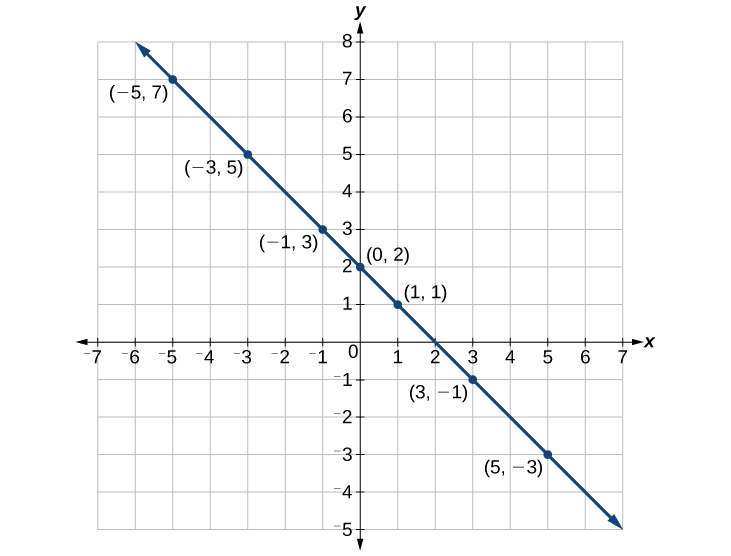
Graph the equation [latex]y=-x+2[/latex] by plotting points.
Answer:
First, we construct a table similar to the one below. Choose x values and calculate y.
| [latex]x[/latex] |
[latex]y=-x+2[/latex] |
[latex]\left(x,y\right)[/latex] |
| [latex]-5[/latex] |
[latex]y=-\left(-5\right)+2=7[/latex] |
[latex]\left(-5,7\right)[/latex] |
| [latex]-3[/latex] |
[latex]y=-\left(-3\right)+2=5[/latex] |
[latex]\left(-3,5\right)[/latex] |
| [latex]-1[/latex] |
[latex]y=-\left(-1\right)+2=3[/latex] |
[latex]\left(-1,3\right)[/latex] |
| [latex]0[/latex] |
[latex]y=-\left(0\right)+2=2[/latex] |
[latex]\left(0,2\right)[/latex] |
| [latex]1[/latex] |
[latex]y=-\left(1\right)+2=1[/latex] |
[latex]\left(1,1\right)[/latex] |
| [latex]3[/latex] |
[latex]y=-\left(3\right)+2=-1[/latex] |
[latex]\left(3,-1\right)[/latex] |
| [latex]5[/latex] |
[latex]y=-\left(5\right)+2=-3[/latex] |
[latex]\left(5,-3\right)[/latex] |
Now, plot the points. Connect them if they form a line.
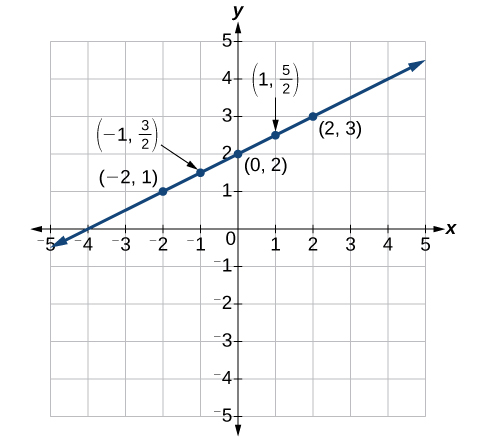
Try It
Construct a table and graph the equation by plotting points: [latex]y=\frac{1}{2}x+2[/latex].
Answer:
| [latex]x[/latex] |
[latex]y=\frac{1}{2}x+2[/latex] |
[latex]\left(x,y\right)[/latex] |
| [latex]-2[/latex] |
[latex]y=\frac{1}{2}\left(-2\right)+2=1[/latex] |
[latex]\left(-2,1\right)[/latex] |
| [latex]-1[/latex] |
[latex]y=\frac{1}{2}\left(-1\right)+2=\frac{3}{2}[/latex] |
[latex]\left(-1,\frac{3}{2}\right)[/latex] |
| [latex]0[/latex] |
[latex]y=\frac{1}{2}\left(0\right)+2=2[/latex] |
[latex]\left(0,2\right)[/latex] |
| [latex]1[/latex] |
[latex]y=\frac{1}{2}\left(1\right)+2=\frac{5}{2}[/latex] |
[latex]\left(1,\frac{5}{2}\right)[/latex] |
| [latex]2[/latex] |
[latex]y=\frac{1}{2}\left(2\right)+2=3[/latex] |
[latex]\left(2,3\right)[/latex] |
Using a Graphing Utility to Plot Lines
You can use an online graphing calculator to quickly plot lines. Watch this short video Tutorial to learn how.
[embed]https://youtu.be/cEIOdi2R4fE[/embed]
Try It
Desmos has a helpful feature that allows you to turn a constant (number) into a variable. Follow these steps to learn how:
- Graph the line [latex]y=-\frac{2}{3}x-\frac{4}{3}[/latex].
- On the next line enter [latex]y=-a x-\frac{4}{3}[/latex]. You will see a button pop up that says "add slider: a", click on the button. You will see the next line populated with the variable a and the interval on which a can take values.
- What part of a line does the variable a represent? The slope or the y-intercept?
Here is a short tutorial with more information about sliders.
https://youtu.be/9MChp2P0vMA

