
Cost and Revenue Problems
Learning Outcomes
- Solve cost and revenue problems
 Using what we have learned about systems of equations, we can answer these questions. The skateboard manufacturer’s revenue equation is the equation used to calculate the amount of money that comes into the business. It can be represented as [latex]y=xp[/latex], where [latex]x=[/latex] quantity and [latex]p=[/latex] price. The revenue equation is shown in orange in the graph below.
The cost equation is the equation used to calculate the costs of doing business. It includes fixed costs, such as rent and salaries, and variable costs, such as utilities. The cost equation is shown in blue in the graph below. The [latex]x[/latex] -axis represents quantity in hundreds of units. The [latex]y-axis[/latex] represents both cost and revenue in hundreds of dollars. We won't learn how to write a cost equation in this example, they will be given to you. If you take any business or economics courses, you will learn more about how to write a cost equation.
Using what we have learned about systems of equations, we can answer these questions. The skateboard manufacturer’s revenue equation is the equation used to calculate the amount of money that comes into the business. It can be represented as [latex]y=xp[/latex], where [latex]x=[/latex] quantity and [latex]p=[/latex] price. The revenue equation is shown in orange in the graph below.
The cost equation is the equation used to calculate the costs of doing business. It includes fixed costs, such as rent and salaries, and variable costs, such as utilities. The cost equation is shown in blue in the graph below. The [latex]x[/latex] -axis represents quantity in hundreds of units. The [latex]y-axis[/latex] represents both cost and revenue in hundreds of dollars. We won't learn how to write a cost equation in this example, they will be given to you. If you take any business or economics courses, you will learn more about how to write a cost equation.
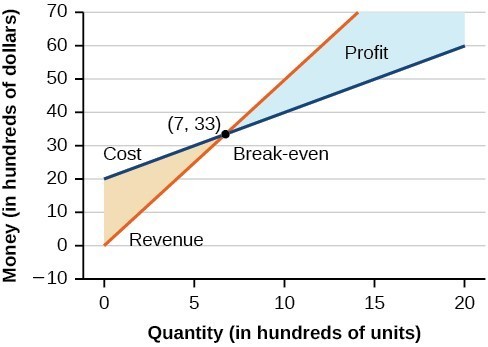 The point at which the two lines intersect is called the break-even point, we learned that this is the solution to the system of linear equations that in this case comprise the cost and revenue equations.
Read the axes of the graph carefully, note that quantity is in hundreds, and money is in thousands. The solution to the graphed system is [latex](7, 33)[/latex]. This means that if [latex]700[/latex] units are produced, the cost to make them is [latex]$3,300[/latex] and the revenue is also [latex]$3,300[/latex]. In other words, the company breaks even if they produce and sell [latex]700[/latex] units. They neither make money nor lose money.
The shaded region to the right of the break-even point represents quantities for which the company makes a profit. The shaded region to the left represents quantities for which the company suffers a loss.
The point at which the two lines intersect is called the break-even point, we learned that this is the solution to the system of linear equations that in this case comprise the cost and revenue equations.
Read the axes of the graph carefully, note that quantity is in hundreds, and money is in thousands. The solution to the graphed system is [latex](7, 33)[/latex]. This means that if [latex]700[/latex] units are produced, the cost to make them is [latex]$3,300[/latex] and the revenue is also [latex]$3,300[/latex]. In other words, the company breaks even if they produce and sell [latex]700[/latex] units. They neither make money nor lose money.
The shaded region to the right of the break-even point represents quantities for which the company makes a profit. The shaded region to the left represents quantities for which the company suffers a loss.
Example
A business wants to manufacture bike frames. Before they start production, they need to make sure they can make a profit with the materials and labor force they have. Their accountant has given them a cost equation of [latex]y=0.85x+35,000[/latex] and a revenue equation of [latex]y=1.55x[/latex]:- Interpret [latex]x[/latex] and [latex]y[/latex] for the cost equation
- Interpret [latex]x[/latex] and [latex]y[/latex] for the revenue equation
Answer: Cost: [latex]y=0.85x+35,000[/latex] Revenue:[latex]y=1.55x[/latex] The cost equation represents money leaving the company, namely how much it costs to produce a given number of bike frames. If we use the skateboard example as a model, [latex]x[/latex] would represent the number of frames produced (instead of skateboards) and y would represent the amount of money it would cost to produce them (the same as the skateboard problem). The revenue equation represents money coming into the company, so in this context [latex]x[/latex] still represents the number of bike frames manufactured, and [latex]y[/latex] now represents the amount of money made from selling them. Let's organize this information in a table:
| Equation Type | [latex]x[/latex] represents | [latex]y[/latex] represents |
| Revenue Eqn. | number of frames | amount of money made selling frames |
| Cost Eqn. | number of frames | cost for making frames |
Example
Given the same cost and revenue equations from the previous example, find the break-even point for the bike manufacturer. Interpret the solution with words. Cost: [latex]y=0.85x+35,000[/latex] Revenue: [latex]y=1.55x[/latex]Answer: Read and Understand: We want the break even point for this system that represents cost and revenue. This means we want to find where the two lines cross, and we have learned a few different methods for doing this because this is the solution to the system of equations! Substitution looks like the easiest method since the revenue equation is already solved for [latex]y[/latex], [latex]y=1.55x[/latex]. Define and Translate: Write the system of equations.
[latex]\begin{array}{l}\\ y=0.85x+35,000\hfill \\ y=1.55x\hfill \end{array}\\[/latex]
Write and Solve: The equations are already written for us, so we just need to solve the system using substitution. Substitute the expression [latex]0.85x+35,000[/latex] from the first equation into the second equation and solve for [latex]x[/latex]. [latex-display]\begin{array}{r}0.85x+35,000=1.55x\\ 35,000=0.7x\,\,\,\\ 50,000=x\,\,\,\,\,\,\,\,\,\,\end{array}\\[/latex-display] Then, we substitute [latex]x=50,000[/latex] into either the cost equation or the revenue equation. [latex-display]1.55\left(50,000\right)=77,500\\[/latex-display] The break-even point is [latex]\left(50,000,77,500\right)[/latex].Check and Interpret:
The solution to this system is[latex]\left(50,000,77,500\right)[/latex], but what does that mean? Think of a point as [latex]\left(x,y\right)[/latex], where in this case x is the quantity of bikes manufactured and [latex]y[/latex] is an amount of money. For our system [latex]y[/latex] represents two different things and [latex]x[/latex] represents one thing. Refer to the table we made in the first example, shown below:| Equation Type | [latex]x[/latex] represents | [latex]y[/latex] represents |
| Revenue Eqn. | number of frames | amount of money made selling frames |
| Cost Eqn. | number of frames | cost for making frames |
Try It
[ohm_question]150438[/ohm_question]Contribute!
Licenses & Attributions
CC licensed content, Original
- System of Equations App: Break-Even Point. Authored by: James Sousa (Mathispower4u.com) for Lumen Learning. License: CC BY: Attribution.
- Revision and Adaptation. Provided by: Lumen Learning License: CC BY: Attribution.
CC licensed content, Shared previously
- College Algebra. Provided by: OpenStax Authored by: Jay Abrams, et al.. Located at: https://openstax.org/textbooks/college-algebra.. License: CC BY: Attribution.
- Unit 14: Systems of Equations and Inequalities, from Developmental Math: An Open Program. Provided by: Monterey Institute of Technology and Education Located at: https://www.nroc.org/. License: CC BY: Attribution.
