
Graphs of Functions
Learning Objectives
- Graph linear functions using a table of values
- Graph a quadratic function using a table of values
- Identify important features of the graphs of a quadratic functions of the form [latex]f(x)=ax^2+bx+c[/latex]
- Graph a radical function using a table of values
- Identify how multiplication can change the graph of a radical function
- Identify how addition and subtraction can change the graph of a radical function
- Define one-to-one function
- Use the horizontal line test to determine whether a function is one-to-one
| x | f(x) |
|---|---|
| x | f(x) |
|---|---|
| [latex]−2[/latex] | |
| [latex]−1[/latex] | |
| [latex]0[/latex] | |
| [latex]1[/latex] | |
| [latex]3[/latex] |
| x | f(x) |
| [latex]−2[/latex] | [latex]−4[/latex] |
| [latex]−1[/latex] | [latex]−1[/latex] |
| [latex]0[/latex] | [latex]2[/latex] |
| [latex]1[/latex] | [latex]5[/latex] |
| [latex]3[/latex] | [latex]11[/latex] |
| x | f(x) |
| [latex]−2[/latex] | [latex]−4[/latex] |
| [latex]−1[/latex] | [latex]−1[/latex] |
| [latex]0[/latex] | [latex]2[/latex] |
| [latex]1[/latex] | [latex]5[/latex] |
| [latex]3[/latex] | [latex]11[/latex] |
 Since the points lie on a line, use a straight edge to draw the line. Try to go through each point without moving the straight edge.
 Let’s try another one. Before you look at the answer, try to make the table yourself and draw the graph on a piece of paper.
Example
Graph [latex]f(x)=−x+1[/latex].Answer: Start with a table of values. You can choose different values for x, but once again, it’s helpful to include 0, some positive values, and some negative values. If you think of f(x) as y, each row forms an ordered pair that you can plot on a coordinate grid.
[latex]f(−2)=−(−2)+1=2+1=3\\f(−1)=−(−1)+1=1+1=2\\f(0)=−(0)+1=0+1=1\\f(1)=−(1)+1=−1+1=0\\f(2)=−(2)+1=−2+1=−1[/latex]
| x | f(x) |
| [latex]−2[/latex] | [latex]3[/latex] |
| [latex]−1[/latex] | [latex]2[/latex] |
| [latex]0[/latex] | [latex]1[/latex] |
| [latex]1[/latex] | [latex]0[/latex] |
| [latex]2[/latex] | [latex]−1[/latex] |
Answer
 Since the points lie on a line, use a straight edge to draw the line. Try to go through each point without moving the straight edge.
A General Note: Linear Function
A linear function is a function whose graph is a line. Linear functions can be written in the slope-intercept form of a line [latex-display]f\left(x\right)=mx+b[/latex-display] where [latex]b[/latex] is the initial or starting value of the function (when input, [latex]x=0[/latex]), and [latex]m[/latex] is the constant rate of change, or slope of the function. The y-intercept is at [latex]\left(0,b\right)[/latex].Graph Quadratic Functions
Quadratic functions can also be graphed. It’s helpful to have an idea what the shape should be, so you can be sure that you’ve chosen enough points to plot as a guide. Let’s start with the most basic quadratic function, [latex]f(x)=x^{2}[/latex]. Graph [latex]f(x)=x^{2}[/latex]. Start with a table of values. Then think of the table as ordered pairs.| x | f(x) |
|---|---|
| [latex]−2[/latex] | [latex]4[/latex] |
| [latex]−1[/latex] | [latex]1[/latex] |
| [latex]0[/latex] | [latex]0[/latex] |
| [latex]1[/latex] | [latex]1[/latex] |
| [latex]2[/latex] | [latex]4[/latex] |
 Since the points are not on a line, you can’t use a straight edge. Connect the points as best you can, using a smooth curve (not a series of straight lines). You may want to find and plot additional points (such as the ones in blue here). Placing arrows on the tips of the lines implies that they continue in that direction forever.
 Notice that the shape is like the letter U. This is called a parabola. One-half of the parabola is a mirror image of the other half. The line that goes down the middle is called the line of reflection, in this case that line is they y-axis. The lowest point on this graph is called the vertex.
In the following video we show an example of plotting a quadratic function using a table of values.
https://youtu.be/wYfEzOJugS8
The equations for quadratic functions have the form [latex]f(x)=ax^{2}+bx+c[/latex] where [latex] a\ne 0[/latex]. In the basic graph above, [latex]a=1[/latex], [latex]b=0[/latex], and [latex]c=0[/latex].
Changing a changes the width of the parabola and whether it opens up ([latex]a>0[/latex]) or down ([latex]a<0[/latex]). If a is positive, the vertex is the lowest point, if a is negative, the vertex is the highest point. In the following example, we show how changing the value of a will affect the graph of the function.
Notice that the shape is like the letter U. This is called a parabola. One-half of the parabola is a mirror image of the other half. The line that goes down the middle is called the line of reflection, in this case that line is they y-axis. The lowest point on this graph is called the vertex.
In the following video we show an example of plotting a quadratic function using a table of values.
https://youtu.be/wYfEzOJugS8
The equations for quadratic functions have the form [latex]f(x)=ax^{2}+bx+c[/latex] where [latex] a\ne 0[/latex]. In the basic graph above, [latex]a=1[/latex], [latex]b=0[/latex], and [latex]c=0[/latex].
Changing a changes the width of the parabola and whether it opens up ([latex]a>0[/latex]) or down ([latex]a<0[/latex]). If a is positive, the vertex is the lowest point, if a is negative, the vertex is the highest point. In the following example, we show how changing the value of a will affect the graph of the function.
Example
Match the following functions with their graph. a) [latex] \displaystyle f(x)=3{{x}^{2}}[/latex] b) [latex] \displaystyle f(x)=-3{{x}^{2}}[/latex] c)[latex] \displaystyle f(x)=\frac{1}{2}{{x}^{2}}[/latex] a) b)
b)
 c)
c)
Answer:
Function a) [latex] \displaystyle f(x)=3{{x}^{2}}[/latex] means that inputs are squared and then multiplied by three, so the outputs will be greater than they would have been for [latex]f(x)=x^2[/latex]. This results in a parabola that has been squeezed, so the graph b) is the best match for this function.
Function b) [latex] \displaystyle f(x)=-3{{x}^{2}}[/latex] means that inputs are squared and then multiplied by negative three, so the outputs will be greater than they would have been for [latex]f(x)=x^2[/latex] so graph a) is the best match for this function.
Function c) [latex] \displaystyle f(x)=\frac{1}{2}{{x}^{2}}[/latex] means that inputs are squared then multiplied by [latex]\frac{1}{2}[/latex], so the outputs are less than they would be for [latex]f(x)=x^2[/latex]. This results in a parabola that has been opened wider than[latex]f(x)=x^2[/latex]. Graph c) is the best match for this function.
Answer
Function a) matches graph b) Function b) matches graph a) Function c) matches graph c)Example
Match the following functions with their graph. a) [latex] \displaystyle f(x)={{x}^{2}}+3[/latex] b) [latex] \displaystyle f(x)={{x}^{2}}-3[/latex] a) b)
b)
Answer:
Function a) [latex] \displaystyle f(x)={{x}^{2}}+3[/latex] means square the inputs then add three, so every output will be moved up 3 units. the graph that matches this function best is b)
Function b) [latex] \displaystyle f(x)={{x}^{2}}-3[/latex] means square the inputs then subtract three, so every output will be moved down 3 units. the graph that matches this function best is a)
Example
Match the following functions with their graph. a) [latex] \displaystyle f(x)={{x}^{2}}+2x[/latex] b) [latex] \displaystyle f(x)={{x}^{2}}-2x[/latex] a) b)
b)
Answer:
Find the vertex of function a)[latex] \displaystyle f(x)={{x}^{2}}+2x[/latex].
a = 1, b = 2
x-value:
[latex-display]\frac{-b}{2a}=\frac{-2}{2(1)}=-1[/latex-display]
y-value:
[latex]f\left(\frac{-b}{2a}\right)=\left(-1)^2+2\left(-1)=1-2=-1[/latex].
Vertex = [latex]\left(-1,-1)[/latex], which means the graph that best fits this function is a)
Find the vertex of function b)[latex] \displaystyle f(x)={{x}^{2}}-2x[/latex].
a = 1, b = -2
x-value:
[latex-display]\frac{-b}{2a}=\frac{2}{2(1)}=1[/latex-display]
y-value:
[latex]f\left(\frac{-b}{2a}\right)=\left(1)^2-2\left(1)=1-2=-1[/latex].
Vertex = [latex]\left(1,-1)[/latex], which means the graph that best fits this function is b)
Properties of a Parabola
For [latex] \displaystyle f(x)=a{{x}^{2}}+bx+c[/latex], where a, b, and c are real numbers.- The parabola opens upward if a > 0 and downward if a < 0.
- a changes the width of the parabola. The parabola gets narrower if |a| is > 1 and wider if |a|<1.
- The vertex depends on the values of a, b, and c. The vertex is [latex]\left(\frac{-b}{2a},f\left( \frac{-b}{2a}\right)\right)[/latex].
Example
Graph [latex]f(x)=−2x^{2}+3x–3[/latex].Answer: Before making a table of values, look at the values of a and c to get a general idea of what the graph should look like. [latex]a=−2[/latex], so the graph will open down and be thinner than [latex]f(x)=x^{2}[/latex]. [latex]c=−3[/latex], so it will move to intercept the y-axis at [latex](0,−3)[/latex]. To find the vertex of the parabola, use the formula [latex] \displaystyle \left( \frac{-b}{2a},f\left( \frac{-b}{2a} \right) \right)[/latex]. Finding the vertex may make graphing the parabola easier.
[latex]\text{Vertex }\text{formula}=\left( \frac{-b}{2a},f\left( \frac{-b}{2a} \right) \right)[/latex]
x-coordinate of vertex:[latex] \displaystyle \frac{-b}{2a}=\frac{-(3)}{2(-2)}=\frac{-3}{-4}=\frac{3}{4}[/latex]
y-coordinate of vertex:[latex] \displaystyle \begin{array}{l}f\left( \frac{-b}{2a} \right)=f\left( \frac{3}{4} \right)\\\,\,\,f\left( \frac{3}{4} \right)=-2{{\left( \frac{3}{4} \right)}^{2}}+3\left( \frac{3}{4} \right)-3\\\,\,\,\,\,\,\,\,\,\,\,\,\,\,\,\,\,\,=-2\left( \frac{9}{16} \right)+\frac{9}{4}-3\\\,\,\,\,\,\,\,\,\,\,\,\,\,\,\,\,\,\,=\frac{-18}{16}+\frac{9}{4}-3\\\,\,\,\,\,\,\,\,\,\,\,\,\,\,\,\,\,\,=\frac{-9}{8}+\frac{18}{8}-\frac{24}{8}\\\,\,\,\,\,\,\,\,\,\,\,\,\,\,\,\,\,\,=-\frac{15}{8}\end{array}\\[/latex]
Vertex: [latex] \displaystyle \left( \frac{3}{4},-\frac{15}{8} \right)\\[/latex] Use the vertex, [latex] \displaystyle \left( \frac{3}{4},-\frac{15}{8} \right)\\[/latex], and the properties you described to get a general idea of the shape of the graph. You can create a table of values to verify your graph. Notice that in this table, the x values increase. The y values increase and then start to decrease again. That indicates a parabola.| x | f(x) |
|---|---|
| [latex]−2[/latex] | [latex]−17[/latex] |
| [latex]−1[/latex] | [latex]−8[/latex] |
| [latex]0[/latex] | [latex]−3[/latex] |
| [latex]1[/latex] | [latex]−2[/latex] |
| [latex]2[/latex] | [latex]−5[/latex] |
Answer
 Connect the points as best you can, using a smooth curve. Remember that the parabola is two mirror images, so if your points don’t have pairs with the same value, you may want to include additional points (such as the ones in blue here). Plot points on either side of the vertex.
[latex]x=\frac{1}{2}[/latex] and [latex]x=\frac{3}{2}[/latex] are good values to include.
Connect the points as best you can, using a smooth curve. Remember that the parabola is two mirror images, so if your points don’t have pairs with the same value, you may want to include additional points (such as the ones in blue here). Plot points on either side of the vertex.
[latex]x=\frac{1}{2}[/latex] and [latex]x=\frac{3}{2}[/latex] are good values to include.
Graph Radical Functions
You can also graph radical functions (such as square root functions) by choosing values for x and finding points that will be on the graph. Again, it’s helpful to have some idea about what the graph will look like. Think about the basic square root function, [latex]f(x)=\sqrt{x}[/latex]. Let’s take a look at a table of values for x and y and then graph the function. (Notice that all the values for x in the table are perfect squares. Since you are taking the square root of x, using perfect squares makes more sense than just finding the square roots of 0, 1, 2, 3, 4, etc.)| x | f(x) |
|---|---|
|
0 |
0 |
|
1 |
1 |
|
4 |
2 |
|
9 |
3 |
|
16 |
4 |
Example
Match each of the following functions to the graph that it represents. a) [latex]f(x)=-\sqrt{x}[/latex] b)[latex]f(x)=2\sqrt{x}[/latex] c) [latex]f(x)=\frac{1}{2}\sqrt{x}[/latex] a) b)
b)
 c)
c)
Answer:
Function a) [latex]f(x)=-\sqrt{x}[/latex] means that all the outputs will be negative - the function is the negative of the square roots of the input. This will give the other half of the parabola on it's side. Therefore the graph
goes with the function [latex]f(x)=-\sqrt{x}[/latex]
Function b)[latex]f(x)=2\sqrt{x}[/latex] means take the square root of all the inputs, then multiply by two, so the outputs will be larger than the outputs for [latex]\sqrt{x}[/latex]. The graph
goes with the function [latex]f(x)=2\sqrt{x}[/latex]
Function c) [latex]f(x)=\frac{1}{2}\sqrt{x}[/latex] means take the squat=re root of the inputs then multiply by [latex]\frac{1}{2}[/latex]. The outputs will be smaller than the outputs for [latex]\sqrt{x}[/latex]. The graph
goes with the function [latex]f(x)=\frac{1}{2}\sqrt{x}[/latex].
Answer
Function a) goes with graph b) Function b) goes with graph a) Function c) goes with graph c)Example
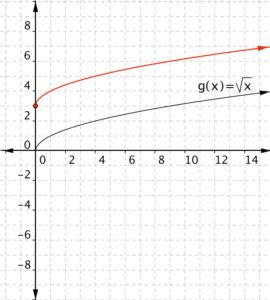
Match each of the following functions to the graph that it represents. a) [latex] f(x)=\sqrt{x}+3[/latex] b)[latex] f(x)=\sqrt{x}-2[/latex] a) b)
b)
Answer:
Function a) [latex] f(x)=\sqrt{x}+3[/latex] means take the square root of all the inputs and add three, so the out puts will be greater than those for [latex]\sqrt{x}[/latex], therefore the graph that goes with this function is
Function b) [latex]f(x)=\sqrt{x}-2[/latex] means take the square root of the input then subtract two. The outputs will be less than those for [latex]\sqrt{x}[/latex], therefore the graph that goes with this function is
Answer
Function a) goes with graph b) Function b) goes with graph a)Example
Match each of the following functions to the graph that it represents. a) [latex]f(x)=\sqrt{x+1}[/latex] b)[latex]f(x)=\sqrt{x-2}[/latex] a) b)
b)
Answer:
Function a) [latex]f(x)=\sqrt{x+1}[/latex] adds one to the inputs before the square root is taken. The outputs will be greater, so it ends up looking like a shift to the left. The graph that matches this function is
Function b) [latex]f(x)=\sqrt{x-2}[/latex] means subtract before the square root is taken. This makes the outputs less than they would be for the standard [latex]\sqrt{x}[/latex], and looks like a shift to the right. the graph that matches this function is
Answer
Function a) matches graph b) Function b) matches graph a)Example
Graph [latex] f(x)=-2+\sqrt{x-1}[/latex].Answer: Before making a table of values, look at the function equation to get a general idea what the graph should look like. Inside the square root, you’re subtracting 1, so the graph will move to the right 1 from the basic [latex] f(x)=\sqrt{x}[/latex] graph. You’re also adding [latex]−2[/latex] outside the square root, so the graph will move down two from the basic [latex] f(x)=\sqrt{x}[/latex] graph. Create a table of values. Choose values that will make your calculations easy. You want [latex]x–1[/latex] to be a perfect square (0, 1, 4, 9, and so on) so you can take the square root.
| x | f(x) |
|---|---|
| [latex]1[/latex] | [latex]−2[/latex] |
| [latex]2[/latex] | [latex]−1[/latex] |
| [latex]5[/latex] | [latex]0[/latex] |
| [latex]10[/latex] | [latex]1[/latex] |
Connect the points as best you can, using a smooth curve.
Answer
Identify a One-to-One Function
Remember that in a function, the input value must have one and only one value for the output. There is a name for the set of input values and another name for the set of output values for a function. The set of input values is called the domain of the function. And the set of output values is called the range of the function. In the first example we remind you how to define domain and range using a table of values.Example
Find the domain and range for the function.|
x |
y |
|---|---|
|
−5 |
−6 |
|
−2 |
−1 |
|
−1 |
0 |
|
0 |
3 |
|
5 |
15 |
Answer: The domain is the set of inputs or x-coordinates.
[latex]\{−5,−2,−1,0,5\}[/latex]
The range is the set of outputs of y-coordinates.[latex]\{−6,−1,0,3,15\}[/latex]
Answer
[latex-display]\begin{array}{l}\text{Domain}:\{−5,−2,−1,0,5\}\\\text{Range}:\{−6,−1,0,3,15\}\end{array}\\[/latex-display]
However, some functions have only one input value for each output value, as well as having only one output for each input. We call these functions one-to-one functions. As an example, consider a school that uses only letter grades and decimal equivalents, as listed in.
| Letter grade | Grade point average |
|---|---|
| A | 4.0 |
| B | 3.0 |
| C | 2.0 |
| D | 1.0 |
This grading system represents a one-to-one function, because each letter input yields one particular grade point average output and each grade point average corresponds to one input letter.
To visualize this concept, let’s look again at the two simple functions sketched in (a)and (b) of Figure 10.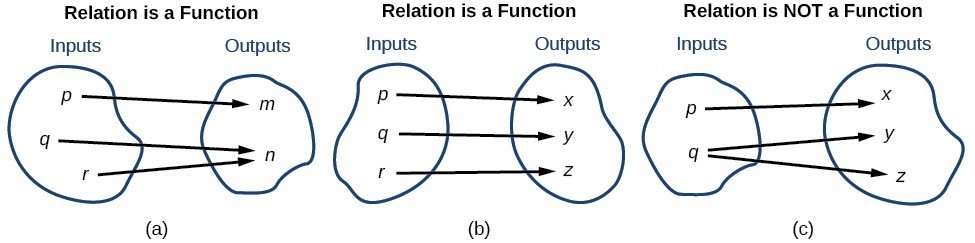 Figure 10
A General Note: One-to-One Function
A one-to-one function is a function in which each output value corresponds to exactly one input value.Example
Which table represents a one-to-one function? a)| input | output |
| 1 | 5 |
| 12 | 2 |
| 0 | -1 |
| 4 | 2 |
| -5 | 0 |
| input | output |
| 4 | 8 |
| 8 | 16 |
| 16 | 32 |
| 32 | 64 |
| 64 | 128 |
Answer: Table a) maps the output value 2 to two different input values, therefore this is NOT a one-to-one function. Table b) maps each output to one unique input, therefore this IS a one-to-one function.
Answer
Table b) is one-to-oneUsing the Horizontal Line Test
An easy way to determine whether a function is a one-to-one function is to use the horizontal line test on the graph of the function. To do this, draw horizontal lines through the graph. If any horizontal line intersects the graph more than once, then the graph does not represent a one-to-one function.
How To: Given a graph of a function, use the horizontal line test to determine if the graph represents a one-to-one function.
- Inspect the graph to see if any horizontal line drawn would intersect the curve more than once.
- If there is any such line, determine that the function is not one-to-one.
Exercises
For the following graphs, determine which represent one-to-one functions.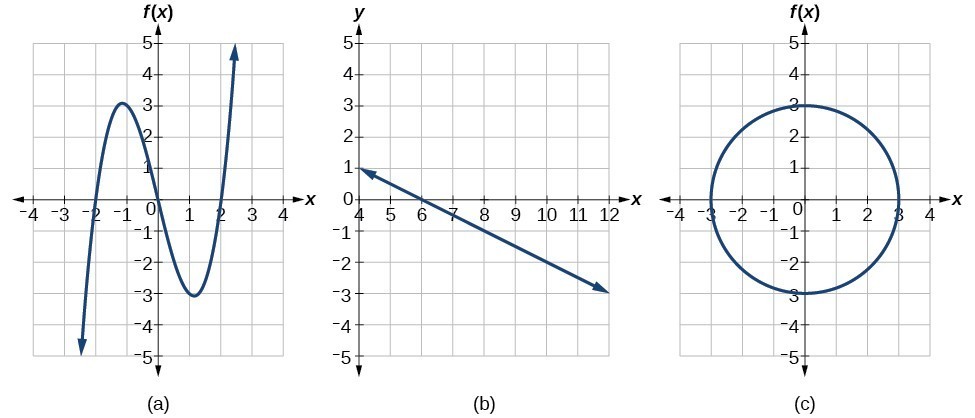
Answer:
The function in (a) is not one-to-one. Using the horizontal line test, as shown below, it intersects the graph of the function at two points (and we can even find horizontal lines that intersect it at three points.)

 The function (c) is not one-to-one, and is in fact not a function.

Summary
In real life and in algebra, different variables are often linked. When a change in value of one variable causes a change in the value of another variable, their interaction is called a relation. A relation has an input value which corresponds to an output value. When each input value has one and only one output value, that relation is a function. Functions can be written as ordered pairs, tables, or graphs. The set of input values is called the domain, and the set of output values is called the range.Licenses & Attributions
CC licensed content, Original
- Graph a Quadratic Function Using a Table of Value and the Vertex. Authored by: James Sousa (Mathispower4u.com) for Lumen Learning. License: CC BY: Attribution.
- Revision and Adaptation. Provided by: Lumen Learning License: CC BY: Attribution.
CC licensed content, Shared previously
- Ex: Graph a Linear Function Using a Table of Values (Function Notation). Authored by: James Sousa (Mathispower4u.com) . License: CC BY: Attribution.
- Unit 17: Functions, from Developmental Math: An Open Program. Provided by: Monterey Institute of Technology and Education Located at: https://www.nroc.org/. License: CC BY: Attribution.
- Ex: Graph a Quadratic Function Using a Table of Values. Authored by: James Sousa (Mathispower4u.com) . License: CC BY: Attribution.
- Determine if a Relation Given as a Table is a One-to-One Function. Authored by: James Sousa (Mathispower4u.com) for Lumen Learning. License: CC BY: Attribution.
- Ex 1: Use the Vertical Line Test to Determine if a Graph Represents a Function. Authored by: James Sousa (Mathispower4u.com) . License: CC BY: Attribution.
