
Domain and Range of Functions
If you’re in the mood for a scary movie, you may want to check out one of the five most popular horror movies of all time—I am Legend, Hannibal, The Ring, The Grudge, and The Conjuring. Figure 1 shows the amount, in dollars, each of those movies grossed when they were released as well as the ticket sales for horror movies in general by year. Notice that we can use the data to create a function of the amount each movie earned or the total ticket sales for all horror movies by year. In creating various functions using the data, we can identify different independent and dependent variables, and we can analyze the data and the functions to determine the domain and range. In this section, we will investigate methods for determining the domain and range of functions such as these.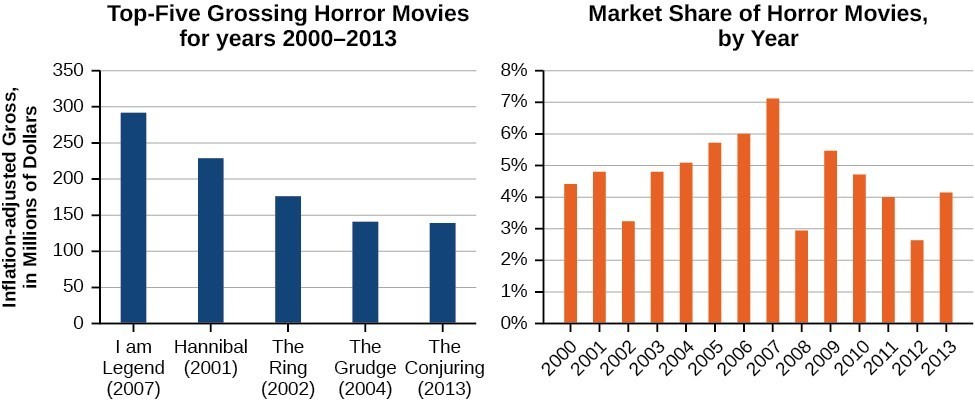 Figure 1. Based on data compiled by www.the-numbers.com.
| Inequality Notation | Set-builder Notation | Interval Notation | |
|---|---|---|---|
 |
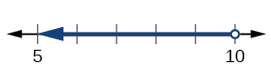
5 < h ≤ 10 | { h | 5 < h ≤ 10} | (5, 10] |
 |
5 ≤ h < 10 | { h | 5 ≤ h < 10} | [5, 10] |
 |
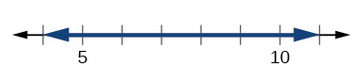
5 < h < 10 | { h | 5 < 10 } | (5, 10) |
 |
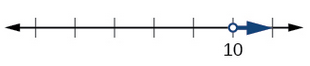
h < 10 | { h | h < 10 } | ( −∞, 10) |
 |
h ≥ 10 | { h | h ≥ 10 } | [10, ∞ ) |
 |
All real numbers | ℝ | ( −∞, ∞ ) |
[latex]\left\{x|\text{ }|x|\ge 3\right\}=\left(-\infty ,-3\right]\cup \left[3,\infty \right)[/latex]
This video describes how to use interval notation to describe a set. https://www.youtube.com/watch?v=hqg85P0ZMZ4 This video describes how to use Set-Builder notation to describe a set. https://www.youtube.com/watch?v=rPcGeaDRnyc&feature=youtu.beA General Note: Set-Builder Notation and Interval Notation
Set-builder notation is a method of specifying a set of elements that satisfy a certain condition. It takes the form [latex]\left\{x|\text{statement about }x\right\}[/latex] which is read as, "the set of all [latex]x[/latex] such that the statement about [latex]x[/latex] is true." For example,[latex]\left\{x|4<x\le 12\right\}[/latex]
Interval notation is a way of describing sets that include all real numbers between a lower limit that may or may not be included and an upper limit that may or may not be included. The endpoint values are listed between brackets or parentheses. A square bracket indicates inclusion in the set, and a parenthesis indicates exclusion from the set. For example,[latex]\left(4,12\right][/latex]
How To: Given a line graph, describe the set of values using interval notation.
- Identify the intervals to be included in the set by determining where the heavy line overlays the real line.
- At the left end of each interval, use [ with each end value to be included in the set (solid dot) or ( for each excluded end value (open dot).
- At the right end of each interval, use ] with each end value to be included in the set (filled dot) or ) for each excluded end value (open dot).
- Use the union symbol [latex]\cup [/latex] to combine all intervals into one set.
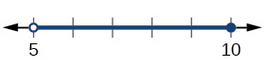
Example: Describing Sets on the Real-Number Line
Describe the intervals of values shown below using inequality notation, set-builder notation, and interval notation.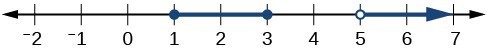
Answer: To describe the values, [latex]x[/latex], included in the intervals shown, we would say, " [latex]x[/latex] is a real number greater than or equal to 1 and less than or equal to 3, or a real number greater than 5."
| Inequality | [latex]1\le x\le 3\text{or}x>5[/latex] |
| Set-builder notation | [latex]\left\{x|1\le x\le 3\text{or}x>5\right\}[/latex] |
| Interval notation | [latex]\left[1,3\right]\cup \left(5,\infty \right)[/latex] |
How To: Given a function written in equation form, find the domain.
- Identify the input values.
- Identify any restrictions on the input and exclude those values from the domain.
- Write the domain in interval form, if possible.
Example: Finding the Domain of a Function
Find the domain of the function [latex]f\left(x\right)={x}^{2}-1[/latex].Answer: The input value, shown by the variable [latex]x[/latex] in the equation, is squared and then the result is lowered by one. Any real number may be squared and then be lowered by one, so there are no restrictions on the domain of this function. The domain is the set of real numbers. In interval form, the domain of [latex]f[/latex] is [latex]\left(-\infty ,\infty \right)[/latex].
Try It
Find the domain of the function: [latex]f\left(x\right)=5-x+{x}^{3}[/latex].Answer: [latex-display]\left(-\infty ,\infty \right)[/latex-display]
How To: Given a function written in equation form including an even root, find the domain.
- Identify the input values.
- Since there is an even root, exclude any real numbers that result in a negative number in the radicand. Set the radicand greater than or equal to zero and solve for [latex]x[/latex].
- The solution(s) are the domain of the function. If possible, write the answer in interval form.
Example: Finding the Domain of a Function with an Even Root
Find the domain of the function [latex]f\left(x\right)=\sqrt{7-x}[/latex].Answer: When there is an even root in the formula, we exclude any real numbers that result in a negative number in the radicand. Set the radicand greater than or equal to zero and solve for [latex]x[/latex].
[latex]\begin{cases}7-x\ge 0\hfill \\ -x\ge -7\hfill \\ x\le 7\hfill \end{cases}[/latex]
Now, we will exclude any number greater than 7 from the domain. The answers are all real numbers less than or equal to [latex]7[/latex], or [latex]\left(-\infty ,7\right][/latex].Try It
Find the domain of the function [latex]f\left(x\right)=\sqrt{5+2x}[/latex].Answer: [latex]\left[-\frac{5}{2},\infty \right)[/latex]
Q & A
Can there be functions in which the domain and range do not intersect at all? Yes. For example, the function [latex]f\left(x\right)=-\frac{1}{\sqrt{x}}[/latex] has the set of all positive real numbers as its domain but the set of all negative real numbers as its range. As a more extreme example, a function’s inputs and outputs can be completely different categories (for example, names of weekdays as inputs and numbers as outputs, as on an attendance chart), in such cases the domain and range have no elements in common.How To: Given the formula for a function, determine the domain and range.
- Exclude from the domain any input values that result in division by zero.
- Exclude from the domain any input values that have nonreal (or undefined) number outputs.
- Use the valid input values to determine the range of the output values.
- Look at the function graph and table values to confirm the actual function behavior.
Example: Finding the Domain and Range Using Toolkit Functions
Find the domain and range of [latex]f\left(x\right)=2{x}^{3}-x[/latex].Answer: There are no restrictions on the domain, as any real number may be cubed and then subtracted from the result. The domain is [latex]\left(-\infty ,\infty \right)[/latex] and the range is also [latex]\left(-\infty ,\infty \right)[/latex].
Example: Finding the Domain and Range
Find the domain and range of [latex]f\left(x\right)=\frac{2}{x+1}[/latex].Answer: We cannot evaluate the function at [latex]-1[/latex] because division by zero is undefined. The domain is [latex]\left(-\infty ,-1\right)\cup \left(-1,\infty \right)[/latex]. Because the function is never zero, we exclude 0 from the range. The range is [latex]\left(-\infty ,0\right)\cup \left(0,\infty \right)[/latex].
Example: Finding the Domain and Range
Find the domain and range of [latex]f\left(x\right)=2\sqrt{x+4}[/latex].Answer: We cannot take the square root of a negative number, so the value inside the radical must be nonnegative. [latex-display]x+4\ge 0\text{ when }x\ge -4[/latex-display] The domain of [latex]f\left(x\right)[/latex] is [latex]\left[-4,\infty \right)[/latex]. We then find the range. We know that [latex]f\left(-4\right)=0[/latex], and the function value increases as [latex]x[/latex] increases without any upper limit. We conclude that the range of [latex]f[/latex] is [latex]\left[0,\infty \right)[/latex].
Analysis of the Solution
The graph below represents the function [latex]f[/latex].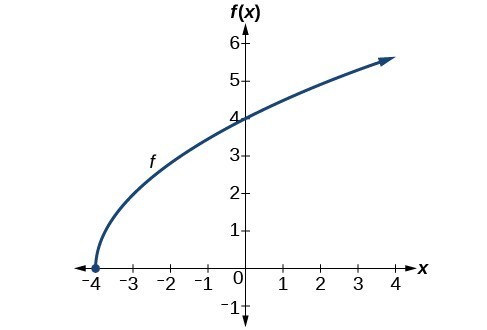
Try It
Find the domain and range of [latex]f\left(x\right)=-\sqrt{2-x}[/latex].Answer: Domain: [latex]\left(-\infty ,2\right][/latex] Range: [latex]\left(-\infty ,0\right][/latex]
 We can observe that the graph extends horizontally from [latex]-5[/latex] to the right without bound, so the domain is [latex]\left[-5,\infty \right)[/latex]. The vertical extent of the graph is all range values [latex]5[/latex] and below, so the range is [latex]\left(\mathrm{-\infty },5\right][/latex]. Note that the domain and range are always written from smaller to larger values, or from left to right for domain, and from the bottom of the graph to the top of the graph for range.
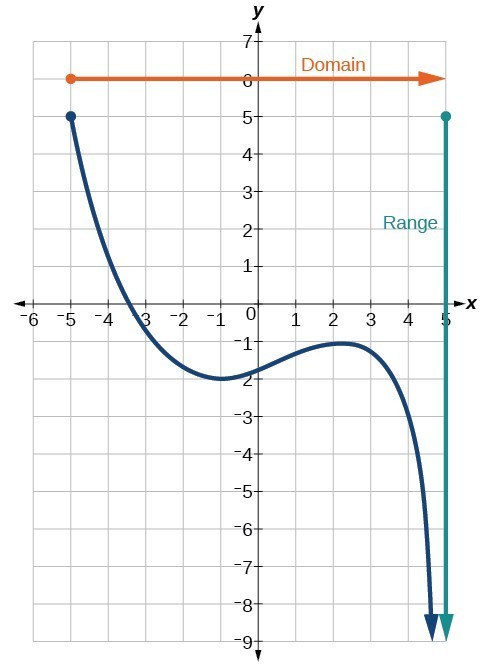
Example: Finding Domain and Range from a Graph
Find the domain and range of the function [latex]f[/latex].![Graph of a function from (-3, 1].](https://s3-us-west-2.amazonaws.com/courses-images/wp-content/uploads/sites/896/2016/10/18193551/CNX_Precalc_Figure_01_02_0072.jpg)
Answer:
We can observe that the horizontal extent of the graph is –3 to 1, so the domain of [latex]f[/latex] is [latex]\left(-3,1\right][/latex].
 The vertical extent of the graph is 0 to [latex]–4[/latex], so the range is [latex]\left[-4,0\right)[/latex].
Example: Finding Domain and Range from a Graph of Oil Production
Find the domain and range of the function [latex]f[/latex].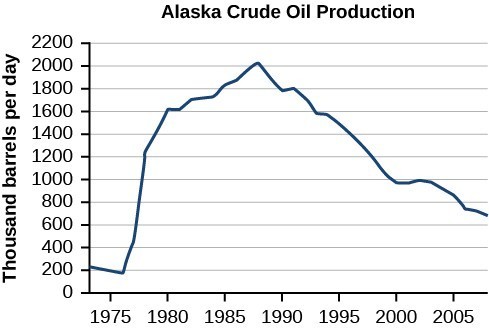 (credit: modification of work by the U.S. Energy Information Administration)
Answer: The input quantity along the horizontal axis is "years," which we represent with the variable [latex]t[/latex] for time. The output quantity is "thousands of barrels of oil per day," which we represent with the variable [latex]b[/latex] for barrels. The graph may continue to the left and right beyond what is viewed, but based on the portion of the graph that is visible, we can determine the domain as [latex]1973\le t\le 2008[/latex] and the range as approximately [latex]180\le b\le 2010[/latex]. In interval notation, the domain is [1973, 2008], and the range is about [180, 2010]. For the domain and the range, we approximate the smallest and largest values since they do not fall exactly on the grid lines.
Try It
Given the graph, identify the domain and range using interval notation.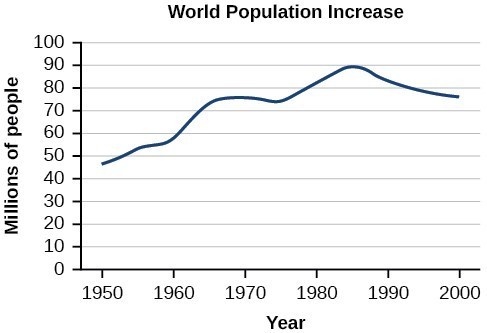
Answer: Domain = [1950, 2002] Range = [47,000,000, 89,000,000]
How To: Given a piecewise function, sketch a graph.
- Indicate on the x-axis the boundaries defined by the intervals on each piece of the domain.
- For each piece of the domain, graph on that interval using the corresponding equation pertaining to that piece. Do not graph two functions over one interval because it would violate the criteria of a function.
Example: Graphing a Piecewise Function
Sketch a graph of the function.[latex]f\left(x\right)=\begin{cases}{ x }^{2} \text{ if }{ x }\le{ 1 }\\ { 3 } \text{ if } { 1 }<{ x }\le 2\\ { x } \text{ if }{ x }>{ 2 }\end{cases}[/latex]
Answer:
Each of the component functions is from our library of toolkit functions, so we know their shapes. We can imagine graphing each function and then limiting the graph to the indicated domain. At the endpoints of the domain, we draw open circles to indicate where the endpoint is not included because of a less-than or greater-than inequality; we draw a closed circle where the endpoint is included because of a less-than-or-equal-to or greater-than-or-equal-to inequality.
Below are the three components of the piecewise function graphed on separate coordinate systems.
(a) [latex]f\left(x\right)={x}^{2}\text{ if }x\le 1[/latex]; (b) [latex]f\left(x\right)=3\text{ if 1< }x\le 2[/latex]; (c) [latex]f\left(x\right)=x\text{ if }x>2[/latex]
 Now that we have sketched each piece individually, we combine them in the same coordinate plane.
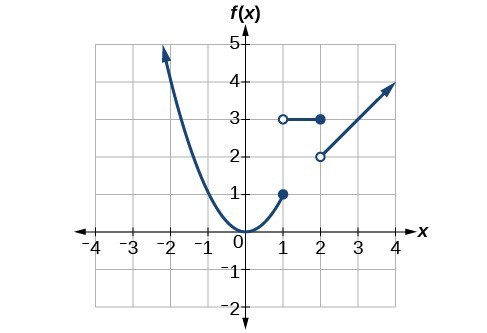
Analysis of the Solution
Note that the graph does pass the vertical line test even at [latex]x=1[/latex] and [latex]x=2[/latex] because the points [latex]\left(1,3\right)[/latex] and [latex]\left(2,2\right)[/latex] are not part of the graph of the function, though [latex]\left(1,1\right)[/latex] and [latex]\left(2,3\right)[/latex] are.Try It
Graph the following piecewise function. [latex-display]f\left(x\right)=\begin{cases}{ x}^{3} \text{ if }{ x }<{-1 }\\ { -2 } \text{ if } { -1 }<{ x }<{ 4 }\\ \sqrt{x} \text{ if }{ x }>{ 4 }\end{cases}[/latex-display]Answer:

Q&A
Can more than one formula from a piecewise function be applied to a value in the domain? No. Each value corresponds to one equation in a piecewise formula.Key Concepts
- The domain of a function includes all real input values that would not cause us to attempt an undefined mathematical operation, such as dividing by zero or taking the square root of a negative number.
- The domain of a function can be determined by listing the input values of a set of ordered pairs.
- The domain of a function can also be determined by identifying the input values of a function written as an equation.
- Interval values represented on a number line can be described using inequality notation, set-builder notation, and interval notation.
- For many functions, the domain and range can be determined from a graph.
- An understanding of toolkit functions can be used to find the domain and range of related functions.
- A piecewise function is described by more than one formula.
- A piecewise function can be graphed using each algebraic formula on its assigned subdomain.
Glossary
- interval notation
- a method of describing a set that includes all numbers between a lower limit and an upper limit; the lower and upper values are listed between brackets or parentheses, a square bracket indicating inclusion in the set, and a parenthesis indicating exclusion
- piecewise function
- a function in which more than one formula is used to define the output
- set-builder notation
- a method of describing a set by a rule that all of its members obey; it takes the form [latex]\left\{x|\text{statement about }x\right\}[/latex]
Licenses & Attributions
CC licensed content, Original
- Revision and Adaptation. Provided by: Lumen Learning License: CC BY: Attribution.
- Question ID 60533, 61836, 47487, 11812. Authored by: Lumen Learning. License: CC BY: Attribution. License terms: IMathAS Community License CC-BY + GPL.
CC licensed content, Shared previously
- College Algebra. Provided by: OpenStax Authored by: Abramson, Jay et al.. Located at: https://openstax.org/books/college-algebra/pages/1-introduction-to-prerequisites. License: CC BY: Attribution. License terms: Download for free at http://cnx.org/contents/[email protected].
- Question ID 108347. Authored by: Coulston, Charles R. License: CC BY: Attribution. License terms: IMathAS Community License CC-BY + GPL.
- Question ID 3190, 3191. Authored by: Anderson, Tophe. License: CC BY: Attribution. License terms: IMathAS Community License CC-BY + GPL.
- Finding Function Values. Authored by: Mathispower4u. License: All Rights Reserved. License terms: Standard YouTube License.
- Ex: Evaluate a Function and Solve for a Function Value Given a Table. Provided by: Phoenix College Authored by: Mathispower4u. License: All Rights Reserved. License terms: Standard YouTube License.
- Ex1: Evaluate a Function and Solve for a Function Value Given a Graph. Provided by: Phoenix College Authored by: Mathispower4u. License: All Rights Reserved. License terms: Standard YouTube License.
- Find Function Inputs for a Given Quadratic Function Output. Authored by: James Sousa. License: All Rights Reserved. License terms: Standard YouTube License.
- Write a Linear Relation as a Function. Authored by: James Sousa. License: All Rights Reserved. License terms: Standard YouTube License.
- Question ID 72181. Authored by: Carmichael, Patrick. License: CC BY: Attribution. License terms: IMathAS Community License CC-BY + GPL.
- Question ID 30831, 32883. Authored by: Smart, Jim. License: CC BY: Attribution. License terms: IMathAS Community License CC-BY + GPL.
- Question ID 92940, 3765, 93008. Authored by: Jenck, Michael. License: CC BY: Attribution. License terms: IMathAS Community License CC-BY + GPL.
- Question ID 47481, 47483, 47484. Authored by: Day, Alyson. License: CC BY: Attribution. License terms: IMathAS Community License CC-BY + GPL.
- Question ID 1657. Authored by: WebWork-Rochester, mb Sousa,James. License: CC BY: Attribution. License terms: IMathAS Community License CC-BY + GPL.
