
Graphs of Quadratic Functions
Curved antennas, such as the ones shown in the photo, are commonly used to focus microwaves and radio waves to transmit television and telephone signals, as well as satellite and spacecraft communication. The cross-section of the antenna is in the shape of a parabola, which can be described by a quadratic function.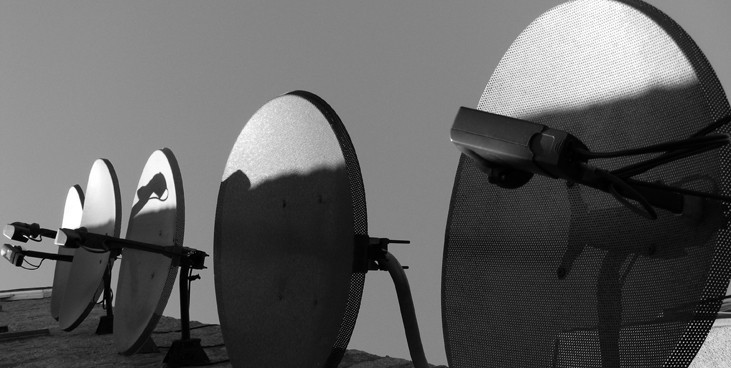 An array of satellite dishes. (credit: Matthew Colvin de Valle, Flickr)
Characteristics of Parabolas
The graph of a quadratic function is a U-shaped curve called a parabola. One important feature of the graph is that it has an extreme point, called the vertex. If the parabola opens up, the vertex represents the lowest point on the graph, or the minimum value of the quadratic function. If the parabola opens down, the vertex represents the highest point on the graph, or the maximum value. In either case, the vertex is a turning point on the graph. The graph is also symmetric with a vertical line drawn through the vertex, called the axis of symmetry.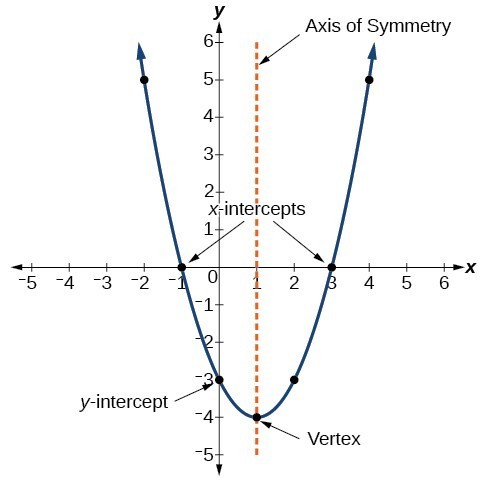 The y-intercept is the point at which the parabola crosses the y-axis. The x-intercepts are the points at which the parabola crosses the x-axis. If they exist, the x-intercepts represent the zeros, or roots, of the quadratic function, the values of x at which y = 0.
Example: Identifying the Characteristics of a Parabola
Determine the vertex, axis of symmetry, zeros, and y-intercept of the parabola shown below.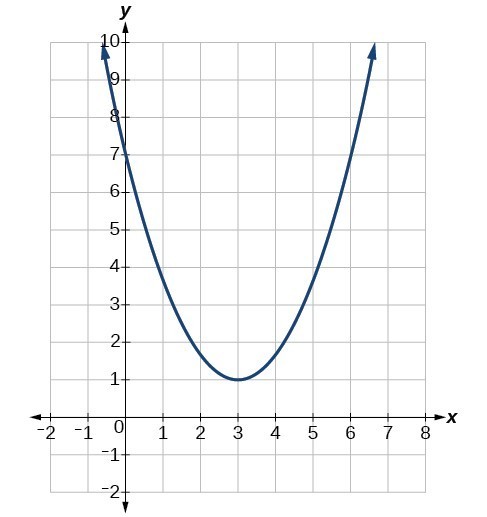
Answer: The vertex is the turning point of the graph. We can see that the vertex is at (3, 1). Because this parabola opens upward, the axis of symmetry is the vertical line that intersects the parabola at the vertex. So the axis of symmetry is x = 3. This parabola does not cross the x-axis, so it has no zeros. It crosses the y-axis at (0, 7) so this is the y-intercept.
Try It
[ohm_question]147099[/ohm_question]Equations of Quadratic Functions
The general form of a quadratic function presents the function in the form[latex]f\left(x\right)=a{x}^{2}+bx+c[/latex]
where a, b, and c are real numbers and [latex]a\ne 0[/latex]. If [latex]a>0[/latex], the parabola opens upward. If [latex]a<0[/latex], the parabola opens downward. We can use the general form of a parabola to find the equation for the axis of symmetry. The axis of symmetry is defined by [latex]x=-\frac{b}{2a}[/latex]. If we use the quadratic formula, [latex]x=\frac{-b\pm \sqrt{{b}^{2}-4ac}}{2a}[/latex], to solve [latex]a{x}^{2}+bx+c=0[/latex] for the x-intercepts, or zeros, we find the value of x halfway between them is always [latex]x=-\frac{b}{2a}[/latex], the equation for the axis of symmetry. The figure below shows the graph of the quadratic function written in general form as [latex]y={x}^{2}+4x+3[/latex]. In this form, [latex]a=1,\text{ }b=4[/latex], and [latex]c=3[/latex]. Because [latex]a>0[/latex], the parabola opens upward. The axis of symmetry is [latex]x=-\frac{4}{2\left(1\right)}=-2[/latex]. This also makes sense because we can see from the graph that the vertical line [latex]x=-2[/latex] divides the graph in half. The vertex always occurs along the axis of symmetry. For a parabola that opens upward, the vertex occurs at the lowest point on the graph, in this instance, [latex]\left(-2,-1\right)[/latex]. The x-intercepts, those points where the parabola crosses the x-axis, occur at [latex]\left(-3,0\right)[/latex] and [latex]\left(-1,0\right)[/latex].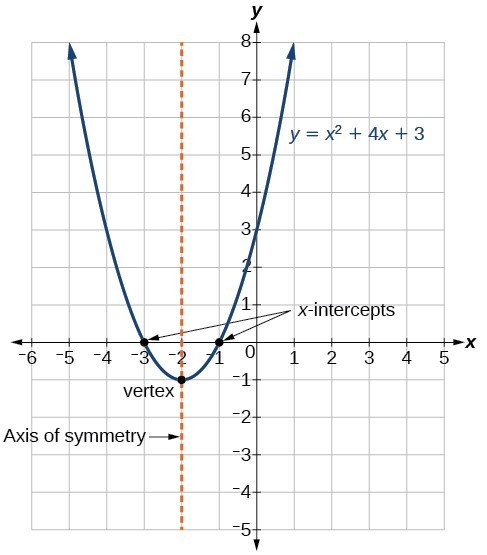 The standard form of a quadratic function presents the function in the form
[latex]f\left(x\right)=a{\left(x-h\right)}^{2}+k[/latex]
where [latex]\left(h,\text{ }k\right)[/latex] is the vertex. Because the vertex appears in the standard form of the quadratic function, this form is also known as the vertex form of a quadratic function.Try It
Use the sliders for h and k to examine how changing the location of the vertex (h,k) of a parabola also changes the axis of symmetry, labeled as x = h. Notice that when you move k independently of h, you are only moving the vertical location of the vertex. https://www.desmos.com/calculator/q3e3ymnpnn The vertex of a parabola is either the maximum or minimum value of the parabola.If [latex]a>0[/latex], the parabola opens upward and the vertex is a minimum. If [latex]a<0[/latex], the parabola opens downward, and the vertex is a maximum. Use the textbox below to determine whether the vertex of the parabola in the interactive above is a minimum or a maximum. [practice-area rows="1"][/practice-area]Given a quadratic function in general form, find the vertex of the parabola.
One reason we may want to identify the vertex of the parabola is that this point will inform us where the maximum or minimum value of the output occurs, (k), and where it occurs, (x). If we are given the general form of a quadratic function:[latex]f(x)=ax^2+bx+c[/latex]
We can define the vertex, [latex](h,k)[/latex], by doing the following:- Identify a, b, and c.
- Find h, the x-coordinate of the vertex, by substituting a and b into [latex]h=-\frac{b}{2a}[/latex].
- Find k, the y-coordinate of the vertex, by evaluating [latex]k=f\left(h\right)=f\left(-\frac{b}{2a}\right)[/latex]
Example: Finding the Vertex of a Quadratic Function
Find the vertex of the quadratic function [latex]f\left(x\right)=2{x}^{2}-6x+7[/latex]. Rewrite the quadratic in standard form (vertex form).Answer: The horizontal coordinate of the vertex will be at
[latex]\begin{array}{c}h=-\frac{b}{2a}\hfill \\ \text{ }=-\frac{-6}{2\left(2\right)}\hfill \\ \text{ }=\frac{6}{4}\hfill \\ \text{ }=\frac{3}{2}\hfill \end{array}[/latex]
The vertical coordinate of the vertex will be at[latex]\begin{array}{c}k=f\left(h\right)\hfill \\ \text{ }=f\left(\frac{3}{2}\right)\hfill \\ \text{ }=2{\left(\frac{3}{2}\right)}^{2}-6\left(\frac{3}{2}\right)+7\hfill \\ \text{ }=\frac{5}{2}\hfill \end{array}[/latex]
Rewriting into standard form, the stretch factor will be the same as the [latex]a[/latex] in the original quadratic.[latex]\begin{array}{c}f\left(x\right)=a{x}^{2}+bx+c\hfill \\ f\left(x\right)=2{x}^{2}-6x+7\hfill \end{array}[/latex]
Using the vertex to determine the shifts,[latex]f\left(x\right)=2{\left(x-\frac{3}{2}\right)}^{2}+\frac{5}{2}[/latex]
Try It
Given the equation [latex]g\left(x\right)=13+{x}^{2}-6x[/latex], write the equation in general form and then in standard form.Answer: [latex]g\left(x\right)={x}^{2}-6x+13[/latex] in general form; [latex]g\left(x\right)={\left(x - 3\right)}^{2}+4[/latex] in standard form
Finding the Domain and Range of a Quadratic Function
Any number can be the input value of a quadratic function. Therefore, the domain of any quadratic function is all real numbers. Because parabolas have a maximum or a minimum point, the range is restricted. Since the vertex of a parabola will be either a maximum or a minimum, the range will consist of all y-values greater than or equal to the y-coordinate at the turning point or less than or equal to the y-coordinate at the turning point, depending on whether the parabola opens up or down.A General Note: Domain and Range of a Quadratic Function
The domain of any quadratic function is all real numbers. The range of a quadratic function written in general form [latex]f\left(x\right)=a{x}^{2}+bx+c[/latex] with a positive a value is [latex]f\left(x\right)\ge f\left(-\frac{b}{2a}\right)[/latex], or [latex]\left[f\left(-\frac{b}{2a}\right),\infty \right)[/latex]; the range of a quadratic function written in general form with a negative a value is [latex]f\left(x\right)\le f\left(-\frac{b}{2a}\right)[/latex], or [latex]\left(-\infty ,f\left(-\frac{b}{2a}\right)\right][/latex]. The range of a quadratic function written in standard form [latex]f\left(x\right)=a{\left(x-h\right)}^{2}+k[/latex] with a positive a value is [latex]f\left(x\right)\ge k[/latex]; the range of a quadratic function written in standard form with a negative a value is [latex]f\left(x\right)\le k[/latex].How To: Given a quadratic function, find the domain and range.
- Identify the domain of any quadratic function as all real numbers.
- Determine whether a is positive or negative. If a is positive, the parabola has a minimum. If a is negative, the parabola has a maximum.
- Determine the maximum or minimum value of the parabola, k.
- If the parabola has a minimum, the range is given by [latex]f\left(x\right)\ge k[/latex], or [latex]\left[k,\infty \right)[/latex]. If the parabola has a maximum, the range is given by [latex]f\left(x\right)\le k[/latex], or [latex]\left(-\infty ,k\right][/latex].
Example: Finding the Domain and Range of a Quadratic Function
Find the domain and range of [latex]f\left(x\right)=-5{x}^{2}+9x - 1[/latex].Answer: As with any quadratic function, the domain is all real numbers. Because a is negative, the parabola opens downward and has a maximum value. We need to determine the maximum value. We can begin by finding the x-value of the vertex.
[latex]\begin{array}{c}h=-\frac{b}{2a}\hfill \\ \text{ }=-\frac{9}{2\left(-5\right)}\hfill \\ \text{ }=\frac{9}{10}\hfill \end{array}[/latex]
The maximum value is given by [latex]f\left(h\right)[/latex].[latex]\begin{array}{c}f\left(\frac{9}{10}\right)=5{\left(\frac{9}{10}\right)}^{2}+9\left(\frac{9}{10}\right)-1\hfill \\ \text{ }=\frac{61}{20}\hfill \end{array}[/latex]
The range is [latex]f\left(x\right)\le \frac{61}{20}[/latex], or [latex]\left(-\infty ,\frac{61}{20}\right][/latex].Try It
Find the domain and range of [latex]f\left(x\right)=2{\left(x-\frac{4}{7}\right)}^{2}+\frac{8}{11}[/latex].Answer: The domain is all real numbers. The range is [latex]f\left(x\right)\ge \frac{8}{11}[/latex], or [latex]\left[\frac{8}{11},\infty \right)[/latex].
Transformations of Quadratic Functions
The standard form of a quadratic function presents the function in the form
where [latex]\left(h,\text{ }k\right)[/latex] is the vertex. Because the vertex appears in the standard form of the quadratic function, this form is also known as the vertex form of a quadratic function.
The standard form is useful for determining how the graph is transformed from the graph of [latex]y={x}^{2}[/latex]. The figure below is the graph of this basic function.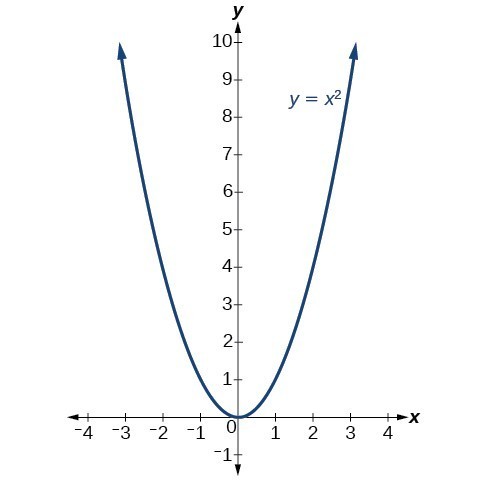
Shift Up and Down by Changing the value of k
You can represent a vertical (up, down) shift of the graph of [latex]f(x)=x^2[/latex] by adding or subtracting a constant, k.
[latex]f(x)=x^2 + k[/latex]
If [latex]k>0[/latex], the graph shifts upward, whereas if [latex]k<0[/latex], the graph shifts downward. Instructions:- Use the slider in the interactive below to shift the graph of [latex]f(x)=x^2[/latex] down 4 units, then up 4 units.
- Use the textbox below the graph to write both transformed equations.
Make Note
Write the equation for the graph of [latex]f(x)=x^2[/latex] that has been shifted up 4 units in the textbox below.[practice-area rows="2"][/practice-area] Now write the equation for the graph of [latex]f(x)=x^2[/latex] that has been shifted down 4 units in the textbox below.[practice-area rows="2"][/practice-area] Now check yourself!Answer: The equation for the graph of [latex]f(x)=x^2[/latex] that has been shifted up 4 units is [latex-display]f(x)=x^2+4[/latex-display] The equation for the graph of [latex]f(x)=x^2[/latex] that has been shifted down 4 units is [latex-display]f(x)=x^2-4[/latex-display]
Shift left and right by changing the value of h.
You can represent a horizontal (left, right) shift of the graph of [latex]f(x)=x^2[/latex] by adding or subtracting a constant, h, to the variable x, before squaring.
[latex]f(x)=(x-h)^2 [/latex]
If [latex]h>0[/latex], the graph shifts toward the right and if [latex]h<0[/latex], the graph shifts to the left. Instructions:- Use the interactive graph below to shift the graph of [latex]f(x)=x^2[/latex] 2 units to the right, then 2 units to the left.
- Use the textbox below the graph to write both transformed equations
Make Note
Write the equation for the graph of [latex]f(x)=x^2[/latex] that has been shifted right 2 units in the textbox below.[practice-area rows="2"][/practice-area] Now write the equation for the graph of [latex]f(x)=x^2[/latex] that has been shifted left 2 units in the textbox below.[practice-area rows="2"][/practice-area] Now check yourself!Answer: The equation for the graph of [latex]f(x)=x^2[/latex] that has been shifted right 2 units is [latex-display]f(x)=(x-2)^2[/latex-display] The equation for the graph of [latex]f(x)=^2[/latex] that has been shifted left 2 units is [latex-display]f(x)=(x+2)^2[/latex-display]
Stretch or compress by changing the value of a.
You can represent a stretch or compression (narrowing, widening) of the graph of [latex]f(x)=x^2[/latex] by multiplying the squared variable by a constant, a.
[latex]f(x)=ax^2 [/latex]
The magnitude of a indicates the stretch of the graph. If [latex]|a|>1[/latex], the point associated with a particular x-value shifts farther from the x-axis, so the graph appears to become narrower, and there is a vertical stretch. But if [latex]|a|<1[/latex], the point associated with a particular x-value shifts closer to the x-axis, so the graph appears to become wider, but in fact there is a vertical compression. Instructions:- Use the interactive graph below to make a graph of the function [latex]f(x)=x^2[/latex] that has been compressed vertically by a factor of [latex]\frac{1}{2}[/latex],
- And another that has been vertically stretched by a factor of 3.
- Use the textbox below the graph to write your equations.
Make Note
Write the equation for the graph of [latex]f(x)=x^2[/latex] that has been has been compressed vertically by a factor of [latex]\frac{1}{2}[/latex] in the textbox below.[practice-area rows="2"][/practice-area] Then, write the equation for the graph of [latex]f(x)=x^2[/latex] that has been vertically stretched by a factor of 3.[practice-area rows="2"][/practice-area] Now check yourself!Answer: The equation for the graph of [latex]f(x)=x^2[/latex] that has been compressed vertically by a factor of [latex]\frac{1}{2}[/latex] [latex-display]f(x)=\frac{1}{2}x^2[/latex-display] The equation for the graph of [latex]f(x)=x^2[/latex] that has been vertically stretched by a factor of 3.is [latex-display]f(x)=3x^2[/latex-display]
The standard form and the general form are equivalent methods of describing the same function. We can see this by expanding out the general form and setting it equal to the standard form.
For the linear terms to be equal, the coefficients must be equal.
This is the axis of symmetry we defined earlier. Setting the constant terms equal:
In practice, though, it is usually easier to remember that k is the output value of the function when the input is h, so [latex]f\left(h\right)=k[/latex].
Now you try it. Use the interactive graph below to define two quadratic functions whose axis of symmetry is x = -3, and whose vertex is (-3, 2). Use the sliders for a, h, k below to help you. https://www.desmos.com/calculator/pimelalx4i Now answer the following questions about the graphs you made.Take Note
How many potential values are there for h in this scenario? [practice-area rows="2"][/practice-area] How about k? [practice-area rows="2"][/practice-area] How about a? [practice-area rows="2"][/practice-area]Answer: There is only one [latex](h,k)[/latex] pair that will satisfy these conditions, [latex](-3,2)[/latex]. The value of a does not affect the line of symmetry or the vertex of a quadratic graph, so a can be an infinite number of values.
Challenge Problem
Define a function whose axis of symmetry is x = -3, and whose vertex is (-3,2) and has an average rate of change of 3/2 on the interval [-2,0]. Here is the interactive graph again, if it helps. https://www.desmos.com/calculator/pimelalx4iTry It
A coordinate grid has been superimposed over the quadratic path of a basketball in the picture below. Find an equation for the path of the ball. Does the shooter make the basket?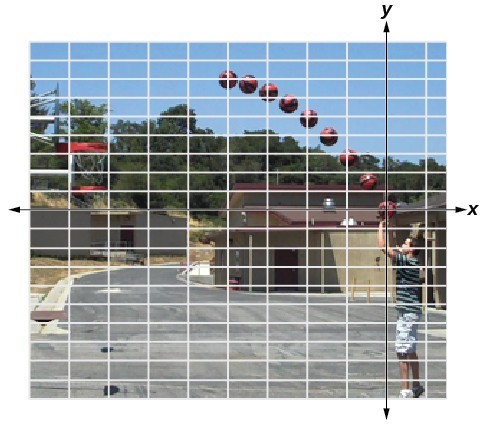 (credit: modification of work by Dan Meyer)
Answer: The path passes through the origin and has vertex at [latex]\left(-4,\text{ }7\right)[/latex], so [latex]\left(h\right)x=-\frac{7}{16}{\left(x+4\right)}^{2}+7[/latex]. To make the shot, [latex]h\left(-7.5\right)[/latex] would need to be about 4 but [latex]h\left(-7.5\right)\approx 1.64[/latex]; he doesn’t make it.
Key Concepts
- A polynomial function of degree two is called a quadratic function.
- The graph of a quadratic function is a parabola. A parabola is a U-shaped curve that can open either up or down.
- The axis of symmetry is the vertical line passing through the vertex.
- Quadratic functions are often written in general form. Standard or vertex form is useful to easily identify the vertex of a parabola. Either form can be written from a graph.
- The vertex can be found from an equation representing a quadratic function.
- The domain of a quadratic function is all real numbers. The range varies with the function.
Glossary
- axis of symmetry
- a vertical line drawn through the vertex of a parabola around which the parabola is symmetric; it is defined by [latex]x=-\frac{b}{2a}[/latex].
- general form of a quadratic function
- the function that describes a parabola, written in the form [latex]f\left(x\right)=a{x}^{2}+bx+c[/latex], where a, b, and c are real numbers and [latex]a\ne 0[/latex].
- standard form of a quadratic function
- the function that describes a parabola, written in the form [latex]f\left(x\right)=a{\left(x-h\right)}^{2}+k[/latex], where [latex]\left(h,\text{ }k\right)[/latex] is the vertex.
Licenses & Attributions
CC licensed content, Original
- Revision and Adaptation. Provided by: Lumen Learning License: CC BY: Attribution.
- Interactive: Transform Quadratic 1. Provided by: Lumen Learning (with Desmos) Located at: https://www.desmos.com/calculator/fpatj6tbcn. License: CC BY: Attribution.
- Interactive: Transform Quadratic 2. Provided by: Lumen Learning (with Desmos) Located at: https://www.desmos.com/calculator/5g3xfhkklq. License: CC BY: Attribution.
- Interactive: Transform Quadratic 3. Provided by: Lumen Learning (with Desmos) Located at: https://www.desmos.com/calculator/ha6gh59rq7. License: CC BY: Attribution.
- Interactive: Tranform Quadratic 4. Provided by: Lumen Learning (with Desmos) Located at: https://www.desmos.com/calculator/pimelalx4i. License: CC BY: Attribution.
- Vertex and Axis of Symmetry Interactive. Authored by: Lumen Learning. Located at: https://www.desmos.com/calculator/q3e3ymnpnn. License: Public Domain: No Known Copyright.
CC licensed content, Shared previously
- College Algebra. Provided by: OpenStax Authored by: Abramson, Jay et al.. Located at: https://openstax.org/books/college-algebra/pages/1-introduction-to-prerequisites. License: CC BY: Attribution. License terms: Download for free at http://cnx.org/contents/[email protected].
- Question ID 120303, 120300. Authored by: Lumen Learning. License: CC BY: Attribution. License terms: IMathAS Community License CC-BY + GPL.
